Mapbox Tutorial 1 - Making a Mapbox Idaho MultiMap
Unfortunately, Google Fusion Tables will be going away by the end of the year. However, there are a few quasi-free mapping alternatives. Mapbox is one of those. There is no charge unless your maps get super popular and receive more than 50,000 map views.
I'm not much of a coder, but I have been experimenting with the javascript necessary to animate Mapbox maps. I have been able to streamline this code and put it on this website to make it easier for you to create your own Mapbox maps by just inputting a few variables.
Here's what you'll need for this exercise:
1) A Mapbox Account. Get a free one on Mapbox.com, if you haven't already.
2) A code compiler, a plain text editor like Notepad, or something to edit text in. I use Sublime Text, but it's probably not necessary for just inputting variables.
3) A website to publish your maps that allows you to insert html/javascript. Wix is offering some free websites and allows you to insert code. I'm sure there are other hosts who do, too. I'm currently using Wix for thecinyc.com and DreamHost for cinycmaps.com - the latter gives me much more flexibility, but Wix is easier to use.
4) My draft Idaho 2014 and Idaho 2018 shapefiles and the U.S. Census Bureau's 2018 Idaho County Shapefile.
For this exercse, I will use the Wincode color scheme. A Wincode is basically a formula I use to determine which candidate has won a precinct. Reds generally output into the 0-1 range, greens in 1-2, blues in 2-3, yellows in 3-4, oranges in 4-5, purples in 5-6, teals 6-7 and light purple/violet in 7-8. Ties are light grey by default and coded as 9. No data is dark grey and coded as 10. Don't worry if you do not have any familiarity with Wincodes - I've already calculated them in the shapefiles. But if you want to make your own map, you can learn more about how I calculate Wincodes in the pinned tweet on my Twitter profile page - @cinyc9.
Step 1 - Getting Started with Mapbox & Uploading your shapefile to Mapbox
Navigate to Mapbox.com and sign in, if you aren't already. If you're already logged in, click on the spaceman icon and navigate to Account.
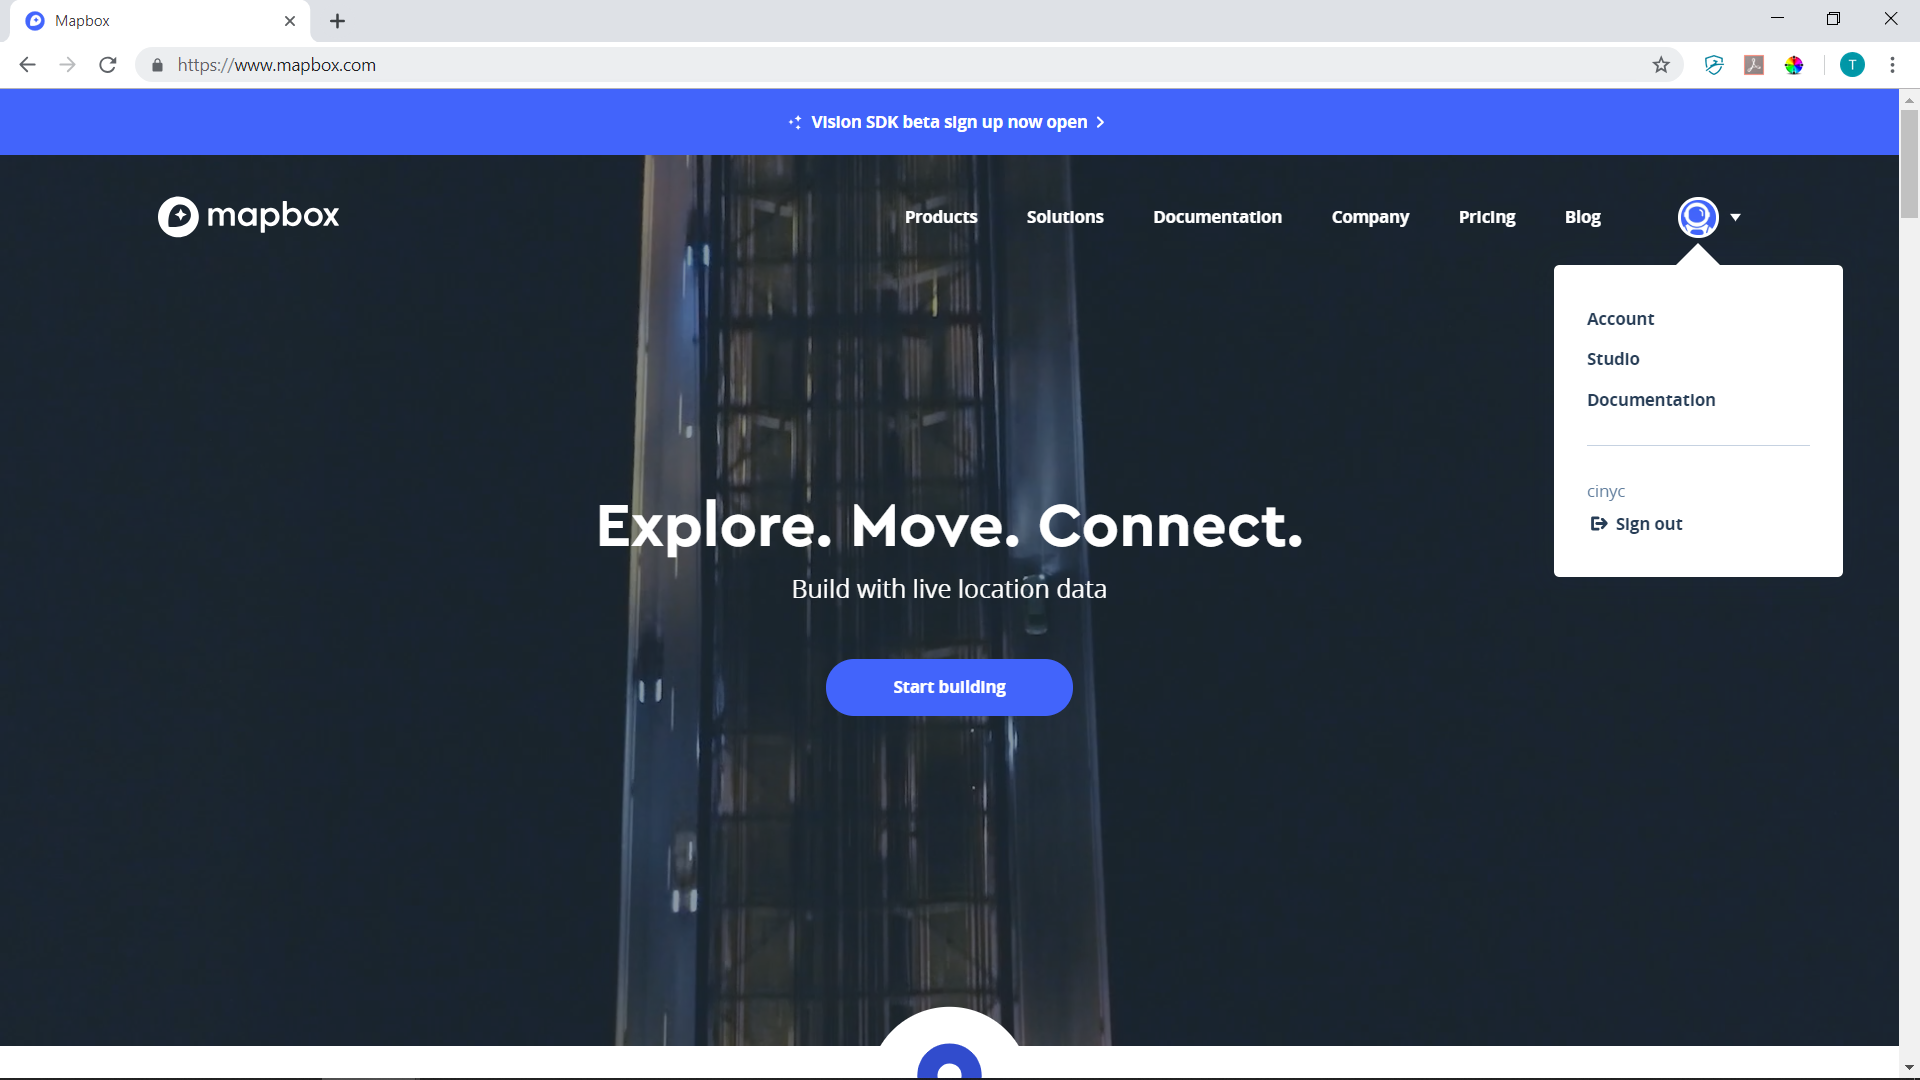
The Account page will give you your basic stats, including the number of Map Views in your billing cycle. As I understand it, Mapbox generally charges you or shuts down your maps when you exceed 50,000 per monthly cycle. This is also where you'll find your Mapbox Access Token, which is necessary to create a map.
If you've never used Mapbox before, you'll need to create a default style to be used as a basemap for the Idaho election layers. If so, click on 1) Start by designing a map. Otherwise, click on 2) the spaceman Icon and select Studio.
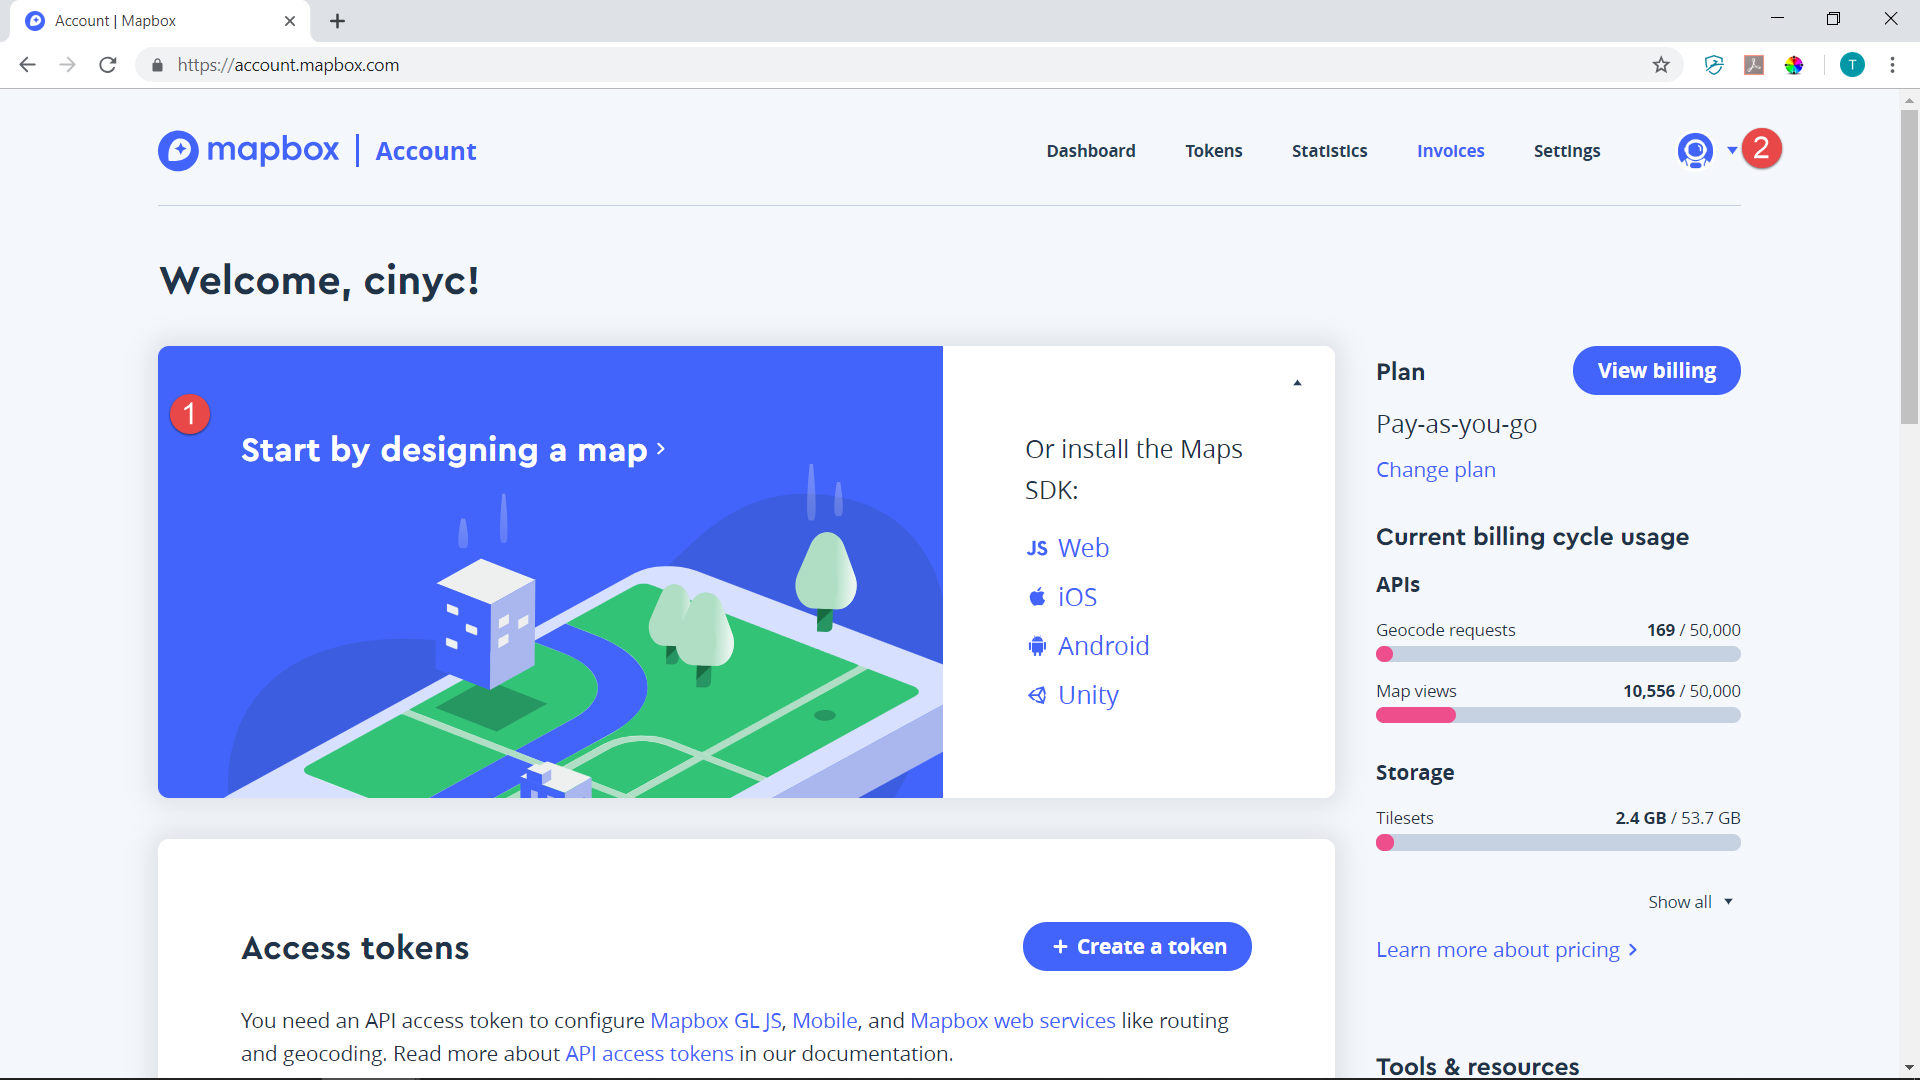
The Mapbox Studio page looks like this:
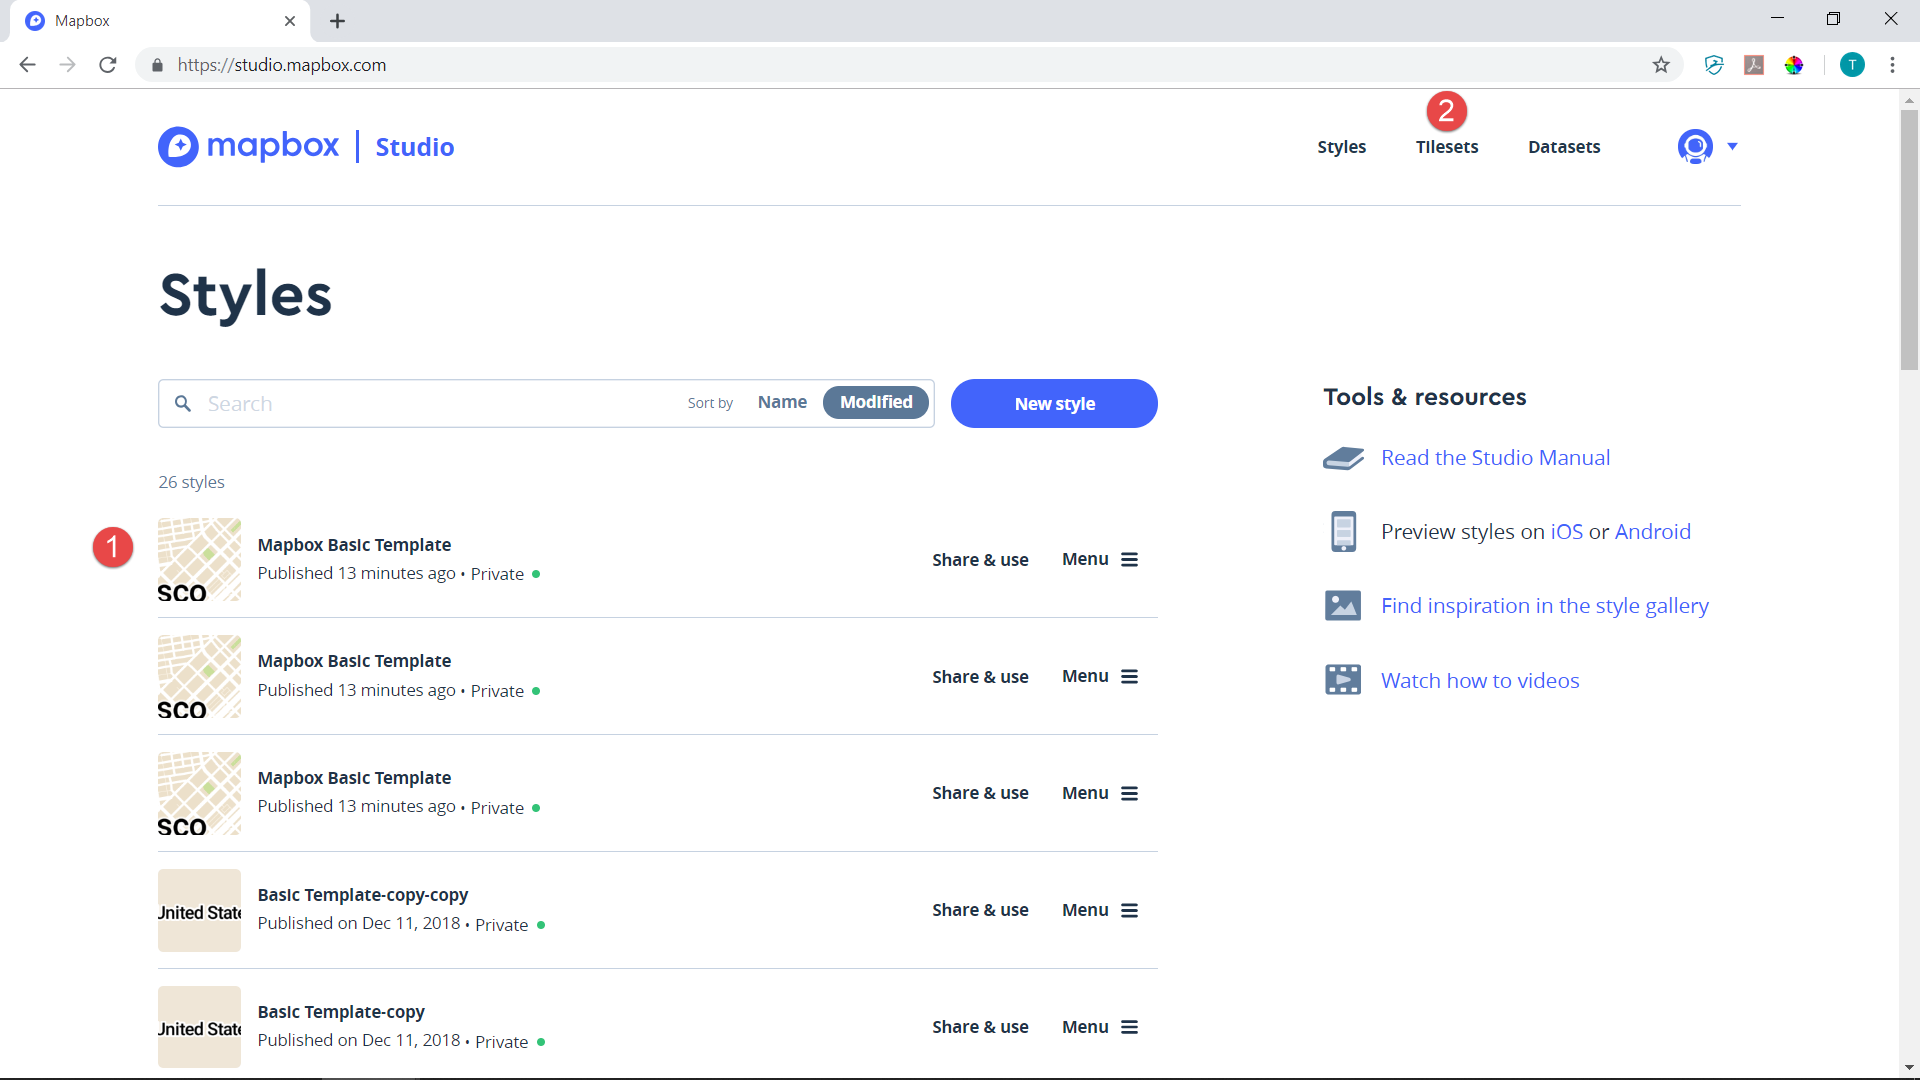
1) If you just created a style, you should see it next to 1. You'll need this style to use as your basemap.
You can always style an election map/shapefile in the Studio by adding it, but I've found that styling it as a Tileset allows for more flexibility. So we'll upload the Idaho files as Tilesets by clicking on (2) Tilesets. A new page called Tilesets that looks a lot like the Styles page will pop up:
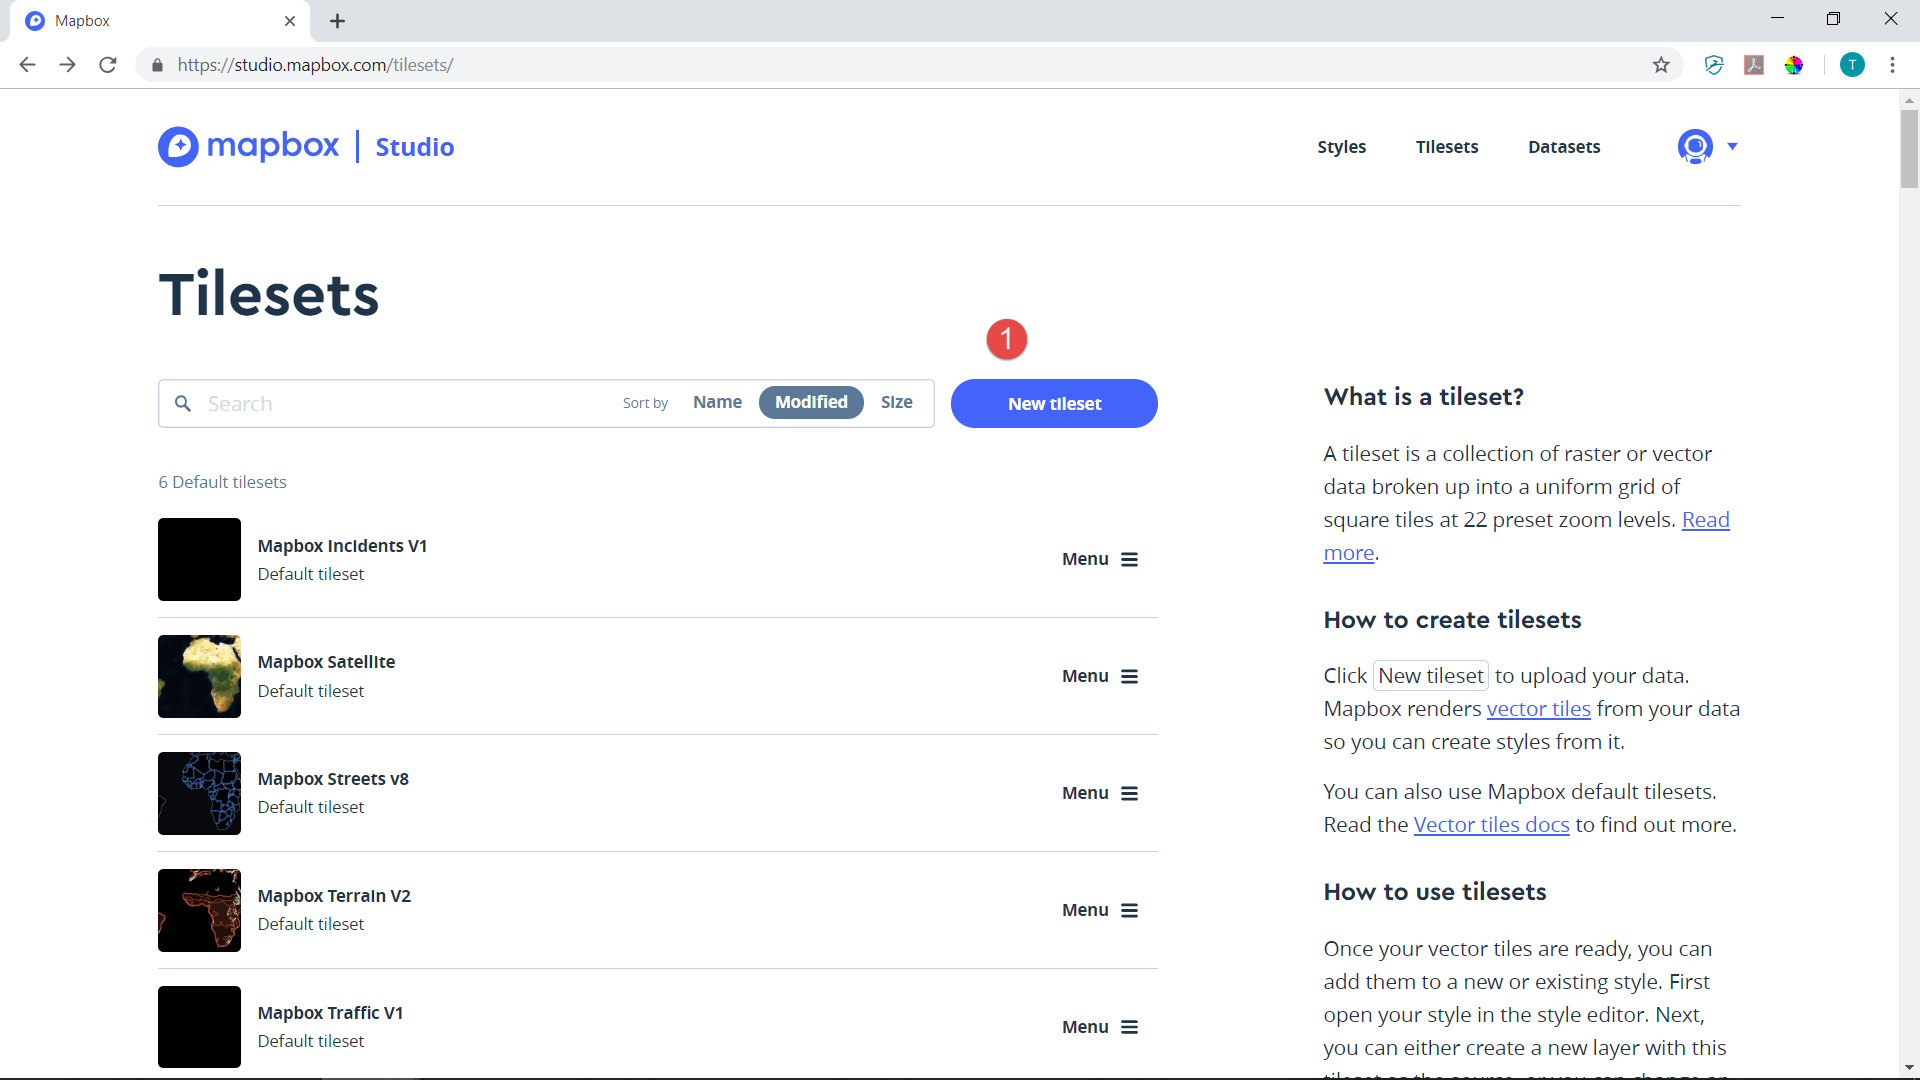
Click on (1) New Tileset. A new window will pop up. Drag and drop or navigate to the Idaho 2018 ZIPPED shapefile package.
Mapbox will now try to import the spreadsheet probably will take a minute or two. The page should look like this:
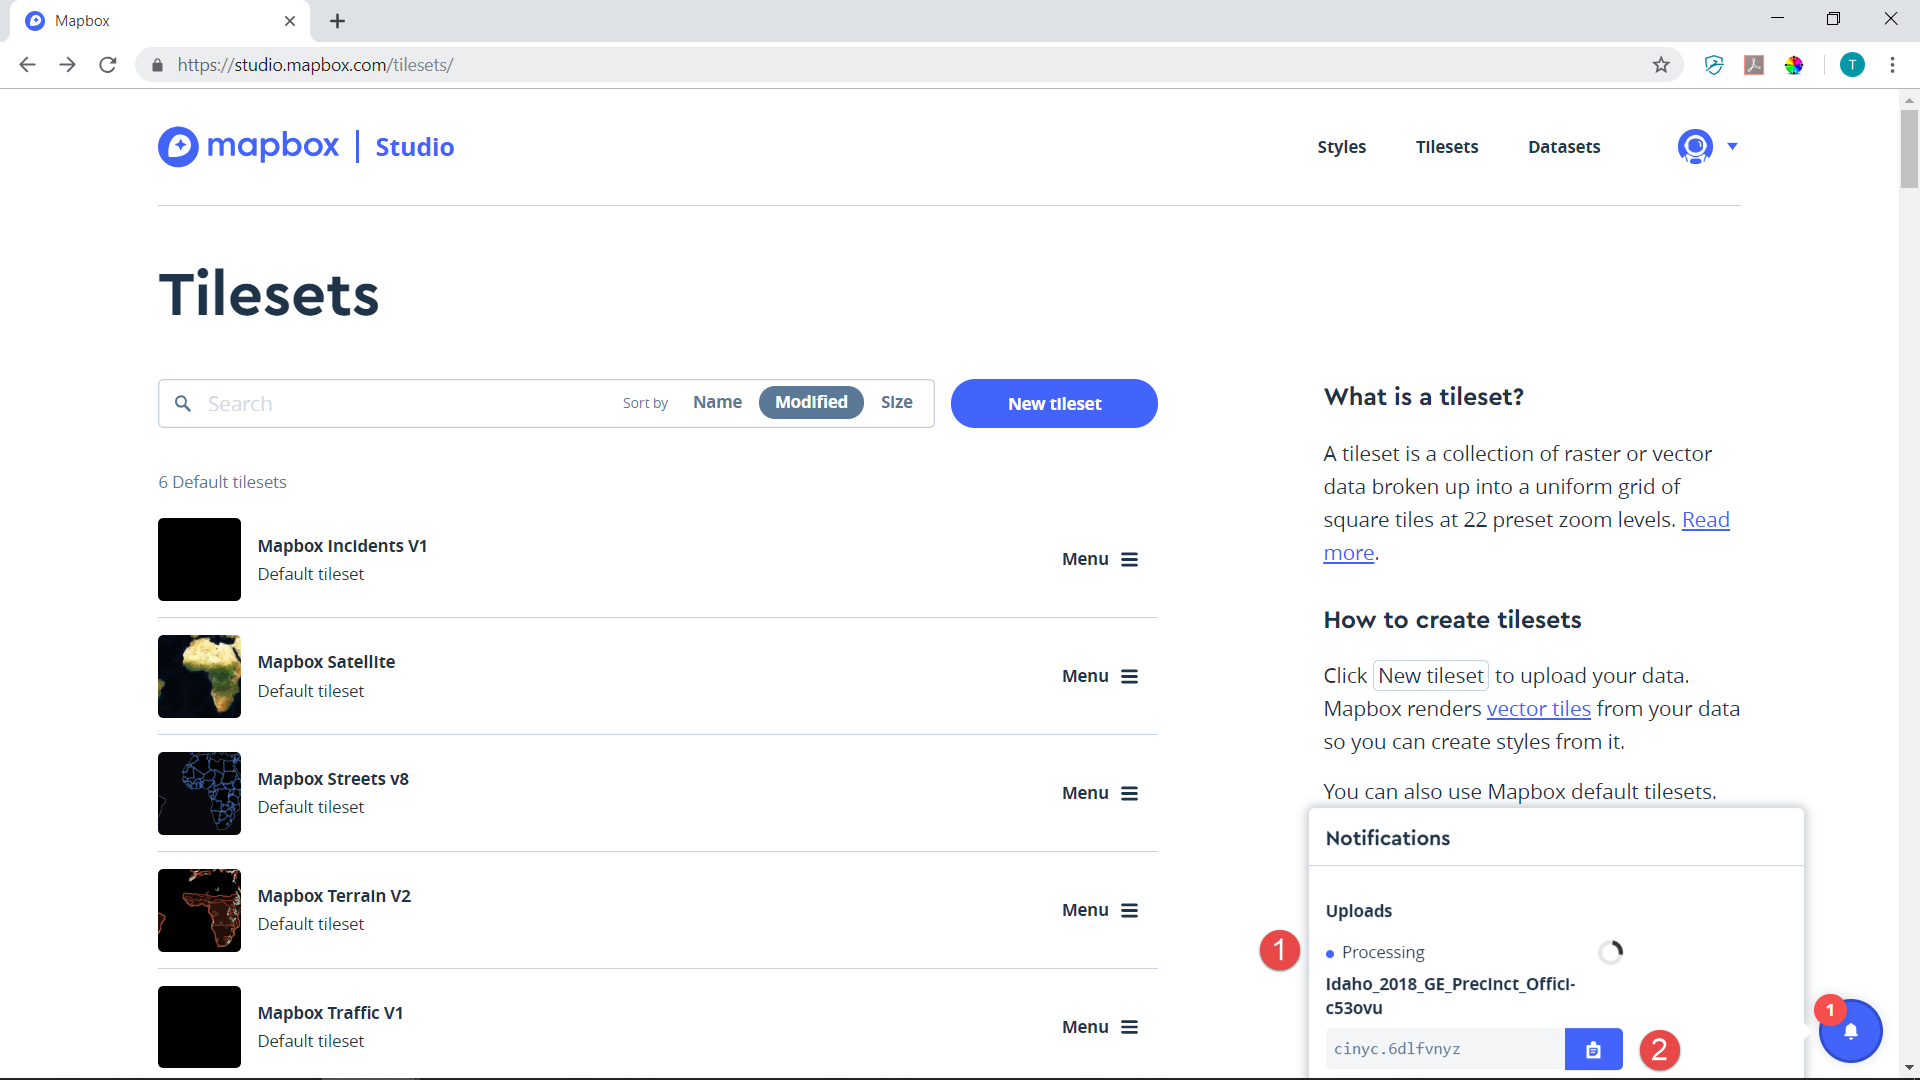
Notice the box that popped up and the bell icon? This box will tell you the status of your upload. A unique tileset name (1) and mapbox URL (2) will be created. We'll need these later.
Assuming your tileset successfully loaded, repeat these steps to add the Idaho 2014 and Idaho County Layers. Once both tilesets have successfully loaded, either hit the bell icon and click the link to the Idaho 2018 layer or scroll down the page to your tilesets and do the same. You should then see a page that looks like this:
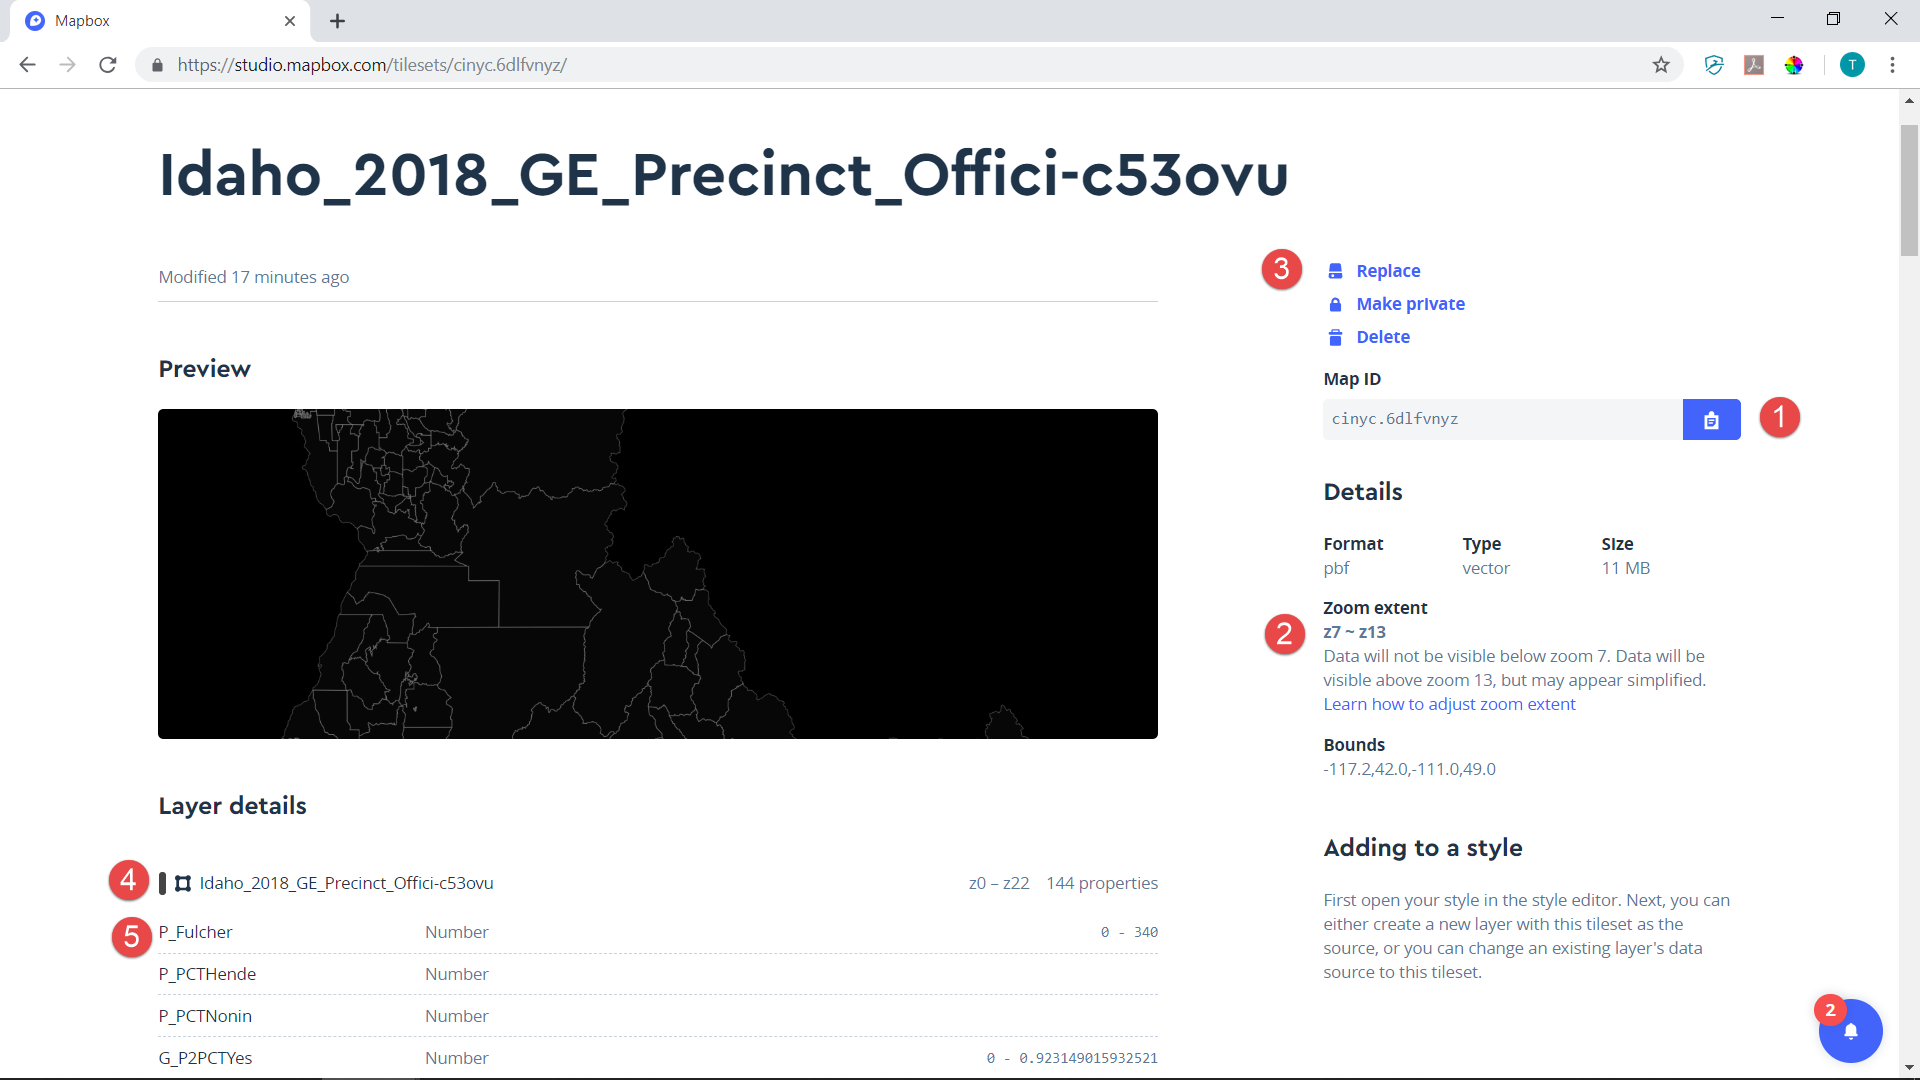
On this page, you'll see the following info:
1) The Map ID. This will be necessary to make our map.
2) The zoom extent. The higher the zoom, the more it zooms in, Unfortunately, my Idaho shapefile is a bit too large to get a zoom below 7, which, given Idaho's size, means you're not going to be able to get the full state ion the map. There's a complicated fix to this that I might explain in a later tutorial, if anyone is interested.
3) The replace/make private/delete buttons. The last two are pretty self-explanatory. The replace button allows you to substitute a later tileset without changing your code, but comes with a caveat - some users might have to refresh their browser image cache to catch the update.
4) The layer name. Usually (but not always) this is the same as the tileset name. We'll need this later.
5) The variables in the shapefile. We'll also need these later.
Step 2 - Creating an html file with variables for a simple one-race map
Next, we'll create an html file with variables to create a simple one-race map. A template for the html file is available for download here or for cutting and pasting on this website here. I'll explain the relevant variables in detail below.
The editing starts at Line 4:
<title>AHR Multi Map</title> <!--Edit Title to reflect your map name. The next few lines load css and java necessary to run Mapbox and/or the tutorial-->
You should change the text inside the <title> tags to reflect your map - Here - ID Gov GE 2014 or something like that. As the explanatory text on the line says, the next few lines load the css and java files necessary to run Mapbox or the tutorial.
The next 150 lines or so are the html that powers the interactive legend box and menu system. The real editing begins on line 162:
mapboxgl.accessToken = ''; //Your Mapbox Token here inside quotes
 var map = new mapboxgl.Map({
 container: 'map', // container id
 style: '', // Your stylesheet location - this is the background map layer - inside quotes
 center: [-99.583333, 39.8333333], // starting position [lng, lat] - must change for your state
 zoom: 7.0 // starting zoom - must change for your tileset
 });
You need to place your Mapbox Token inside the quotes next to mapboxgl.accessToken. You can get your token on your Mapbox Account Page.
Next, enter the location for the background map stylesheet that you want to use inside the quotes next to style:. This is located on your Stylesheet page, and should start with mapbox://styles/.
The center of the map needs to be changed to the center of Idaho - that's -114.75, 44.06. Replace the text in Center with that (no quotes).
Zoom is the initial zoom level. Unfortunately, because my 2014 Idaho shapefile is large, we can't set it less than 7.0. Idaho is a big state, so it won't all be fitting in one map, and zooming out will make it disappear. This can be fixed. I might explain how in a subsequent tutorial if there's interest.
//Layer Names
 var layer = ['','']; //Tileset layer names for your layers. Position 1 is default; position 2 is map 1; position 3 is map 2, etc.
 var layerURL = ['mapbox://','mapbox://'] //Mapbox urls corresponding with your layers. Same order
Next, we'll set the layer names that will be colored in. I have most variables set up using a matrix. The first position is the default map. The second and subsequent positions represent other maps. You can add as many layers as you wish - in theory. Here, we're only going to add one - but ALWAYS make sure to put a layer in the first default position - this powers the default map.
Navigate to the Tileset page and find the Idaho 2014 layer. Click on either the bell icon if you haven't dismissed notifications or scroll down to find it.
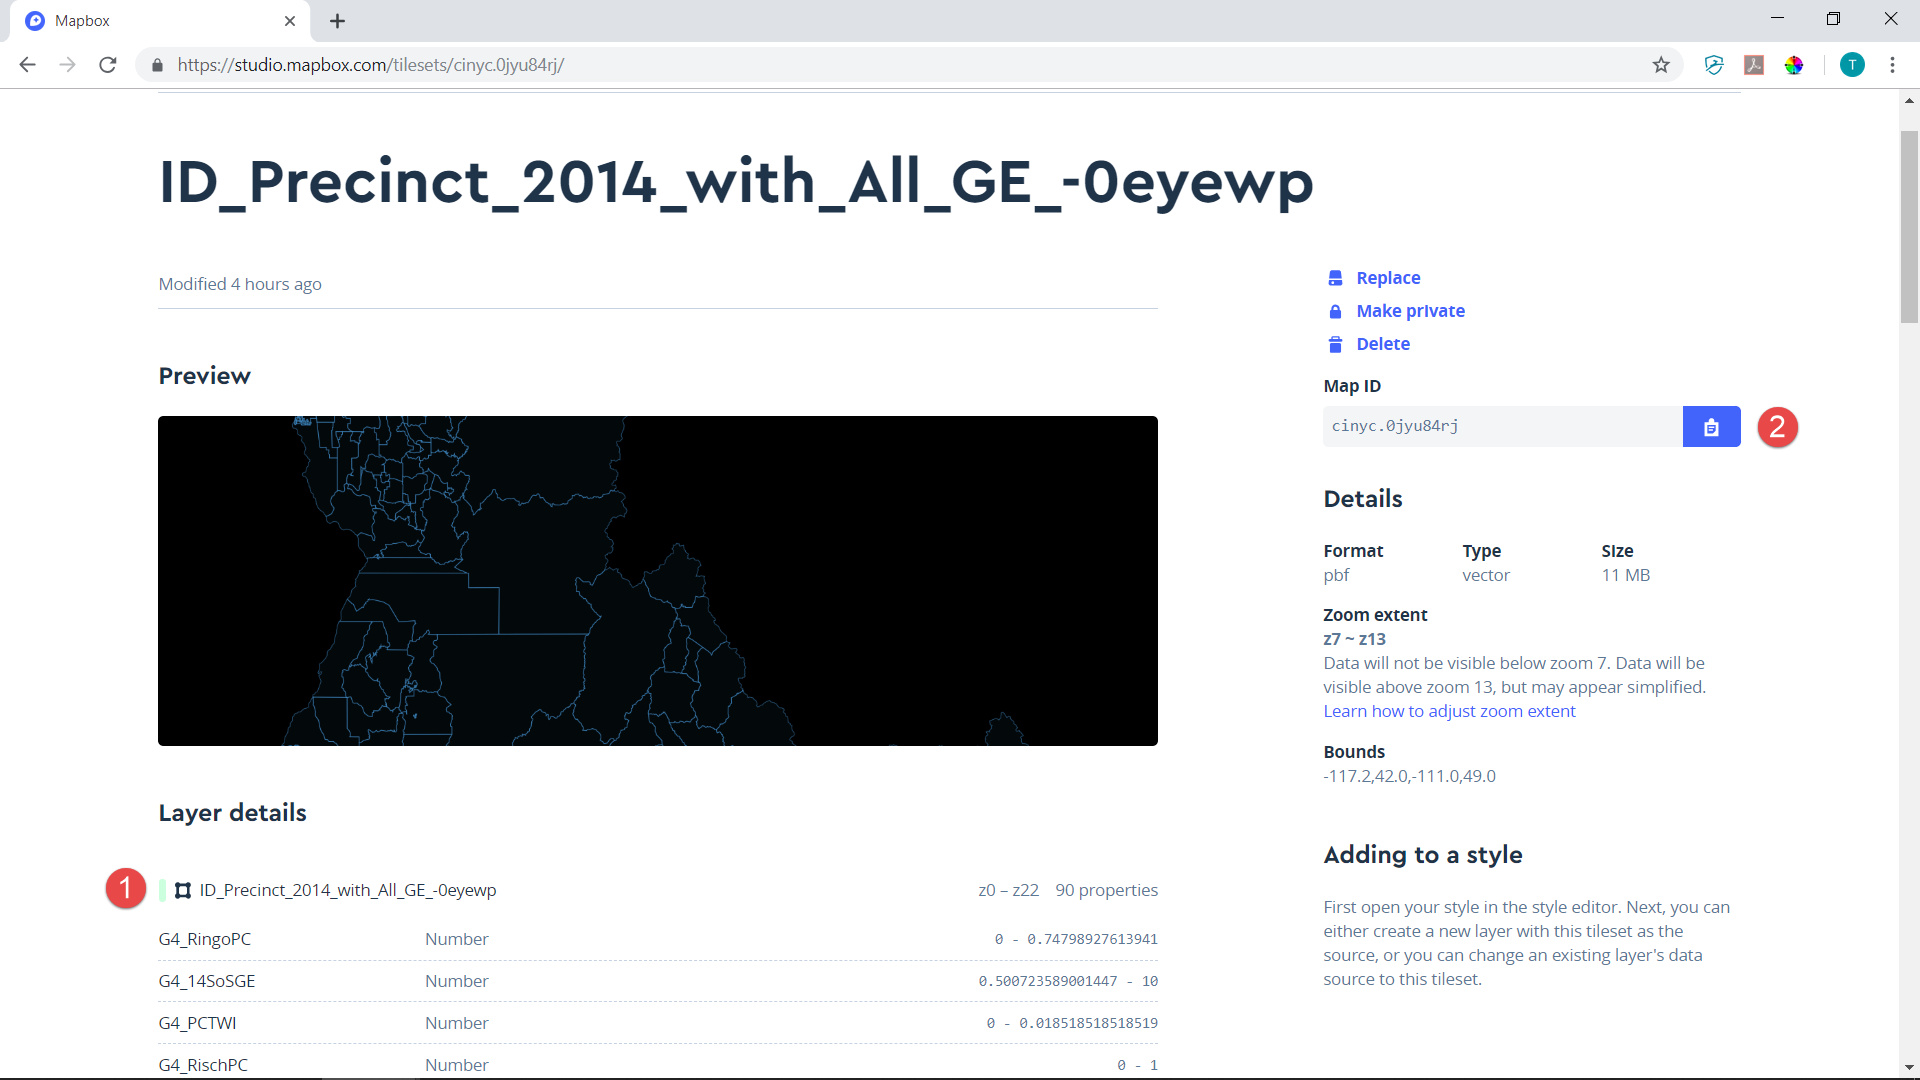
Copy and paste what you see next to 1 on YOUR screen into BOTH the quotes after "var layer". Do not use my layer name - it will not work with your Mapbox Access Token. Next, copy and paste the Map ID AFTER the 'mapbox://' in BOTH quotes after var "layerURL". This will allow your website to import your Mapbox tileset. layerURL MUST start with mapbox://.
 //ColorAnc is Ancestry; ColorWin is Wincode. More to Come
 var Fillcolor = ['ColorWin','ColorWin'] // ColorWin for Wincode Colors; ColorAnc for Ancestry Colors; More to come
 var WinColors = 'cinyc' //Color scheme for Wincode colors on ALL maps. Currently, cinyc for cinyc's lighter colors, JMC for J Miles Coleman's darker colors & Atlas for U.S. Election Atlas colors.
 //Data Source (Optional) anc = ancestry map; win = wincode map - more to come
 var ancsource = '' // Source name for Ancestry Maps(optional)
 var winsource = '' // Source name for Wincode Maps (optional)
The next bit of code is used to choose the colorscheme. We're going to use the Wincode colorscheme. Nothing needs to be changed here. I've also coded the color scheme for my ancestry maps - and more may be coming in the near future, including a margin/swing scheme.
-WinColors is the color scheme for ALL Wincode maps. So far, I've added support for my color scheme ('cinyc'), U.S. Election Atlas' colorscheme ('Atlas'), and J Miles Coleman's color scheme ("JMC"). More schemes can be added on request.
var ancsource and winsource are optional fields to properly attribute your data. Put 'Idaho Secretary of State' after winsource.
Next, we set up the purely toggleable non-colored layers. Here, we'll add the Idaho county outlines from Census' Idaho County shapefile.
 //Toggleable Layer 1 Info Tog1Name may be added to legend. This is usually Counties
 var layerTog1 = '';
 //Tileset name for toggleable layer 1 (usually Counties)
 // Geo Type/Name (usually 'County')
 var Tog1Name = '';
 //Mapbox urls corresponding to Toggleable Layer 1
 var Tog1URL = 'mapbox://';
 //Variable for Tog1 Name (usually County)
 var Tog1Default = ['']
Open your copy of Idaho County and select the layer name. Copy it into the quotes after layerTog1. You only need to do this once.
Next, write "County" in Tog1Name. This is the name that will show up on the menu. Copy and paste the Mapbox URL AFTER the mapbox:// in Tog1URL. Again, this MUST start with mapbox:// or you'll get an error.
Tog1Default is for the county names embedded in the data you are color mapping (i.e. the ID 2014 layer). Unfortunately, I didn't include them in the 2014 data, so you can leave it blank. You also can leave the Tog2 variables blank, as we aren't adding a second toggleable layer here for simplicity's sake. (Sometimes, I'll add a County Subdivision layer).
The next few lines of code drive the layer system.
var toggleableLayerNamesMain = ['Layer'/*Title*/,/*FirstLayerName*/'',/*SecondLayerName*/'',/*ThirdLayerName*/'',/*FourthLayerName*/'',/*FifthLayerName*/'',/*SixthLayerName*/'',/*SeventhLayerName*/'',/*EighthLayerName*/'',/*NinthLayerNam
 e*/,/*TenthLayerName*/,Tog1Name,Tog2Name,'Legend'];
 //Layer numbers for each item in main menu number of entries as toggleableLayerIdsMain. REMOVE quotes when add layer[i]
 var toggleableLayerIdsMain = ['Layer',layer[1]/*FirstLayer*/,/*SecondLayer*/'',/*ThirdLayer*/'',/*FourthLayer*/'',/*FifthLayer*/'',/*SixthLayer*/'',/*SeventhLayer*/'',/*EighthLayer*/'',/*NinthLayer*/'',/*TenthLayer*/'',layerTog1,layerTog2,'Legend'];
 //should be equal to the layer number in toggleablelayerIDsMain. Number should be same as layer[i]
 var layernumbermain = [/*LayerNuberMainDefault*/0,/*LayerNumberMainA1*/1,/*LayerNumberMainA2*/0,/*LayerNumberMainA3*/0,/*LayerNumberMainA4*/0,/*LayerNumberMainA5*/0,/*LayerNumberMainA6*/0,/*LayerNumberMainA7*/0,/*LayerNumberMainA8*/0,/*LayerNumberMainA9*/0,/*LayerNumberMainA10*/0,layerTog1,layerTog2,'Legend'];
 //0 if no lower menu; "Y' If there is a lower menu
 var lowermainmenu = [/*LowerMenuDefault*/0,/*LowerMenuA1*/0,/*LowerMenuA2*/0,/*LowerMenuA3*/0,/*LowerMenuA4*/0,/*LowerMenuA5*/0,/*LowerMenuA6*/0,/*LowerMenuA7*/0,/*LowerMenuA8*/0,/*LowerMenuA9*/,/*LowerMenuA10*/0];
ToggleableLayerNamesMain usually is used for the main menu. But because we're only making a map of one race, it will be our only menu. So all variables mapped should be put in. To make things easier, we'll only code the two main candidates for Idaho Governor in the 2014 general election. We'll manipulate the system to make 3 maps - the Wincode Map, a red-colored map for the Republican candidate, Otter, and a blue-colored map for the Democratic candidate, Balukoff.
I've labeled the cells to make things easier.
In toggleableLayerNamesMain, leave the first variable 'Layer'. Next, type 'Winner' in the quotes after First Layer Name, 'Otter (R)' in the quotes after Second Layer Name and 'Balukoff (D)' in the third. Leave the rest alone. In particular, do NOT remove the /* unless you also remove the text within and the */ - it's a comment that shouldn't show in on the map. Removing the /* will cease to make it a comment and lead to headaches
-toggleableLayerIDsMain defines the layer associated with each name. I've already put layer[1] in First Layer. DELETE the quotes and add layer[1] Second ant Third. Leave the rest the same.
-layernumbermain is just the layer number from inside the brackets. Change LayerNumberMainA2 and A3 from 0 to 1. Leave the rest the same.
-lowermainmenu tells the system whether there is a submenu. 0 means there is none. Since there will be none, leave the variables as is. (You'd change 0 to 'Y' if there is a lower menu).
The next two variables are irrelevant here, as there are no lower menus. You can skip them.
//Layer Type. Likely the same as MenuIDsADefault. First variable should likely be W if Wincode. Subsequent values should be W, R, B, Y, G, O, P, T or V. In Wincode, these are Wincode, Red, Blue, Yellow, Green, Orange, Purple, Teal and Violet color schemes.
 var clickedLayerDefault = [/*DefaultLayerType*/'W',/*LayerTypeA1*/'',/*LayerTypeA2*/'',/*LayerTypeA3*/'',/*LayerTypeA4*/'',/*LayerTypeA5*/'',/*LayerTypeA6*/'',/*LayerTypeA7*/'',/*LayerTypeA8*/'',/*LayerTypeA9*/,'',/*LayerTypeA10*/'']
 //Default LayerType. Likely W under Wincode, unless showing 1 color map.
 var relevantCL = 'W'
clickedLayerDefault tells the system what colors to use when mapping. W means Wincode, R red, B blue, etc. DefaultLayerType is Wincode here. Nothing needs to be changed. The next variable to be mapped will also be Wincode - so put 'W' in the quotes after LayerTypeA1. A2 is the Otter percentage map. Since he's a Republican, that should be red. Type 'R" in the quotes after LayerTypeA2. Finally, A3 is the Balukoff percentage map. Since he's a Democrat, that should be blue. Type 'B' there.
Relevant CL should be 'W' for Wincode, since the default map is Wincode.
Skip the next two lines, as there are no third level menus here. We then arrive at the heart of the variable input.
var TitleDefault = [/*DefaultTitle*/'',/*TitleA1*/'',/*TitleA2*/'',/*TitleA3*/'',/*TitleA4*/'',/*TitleA5*/'',/*TitleA6*/'',/*TitleA7*/'',/*TitleA8*/'',/*TitleA9*/'',/*TitleA10*/'']
 //Wincode Formulas for each menu item. May or may not be identical.
 var WincodeDefault = [/*DefaultWincode*/'',/*WincodeA1*/'',/*WincodeA2*/'',/*WincodeA3*/'',/*WincodeA4*/'',/*WincodeA5*/'',/*WincodeA6*/'',/*WincodeA7*/'',/*WincodeA8*/'',/*WincodeA9*/'',/*WincodeA10*/'']
 //Variable Formulas for each PCT COLOR item. Likely the same for all, unless you have different contests with the same color scheme
 var RedDefault = [/*DefaultRed*/'',/*RedA1*/'',/*RedA2*/'',/*RedA3*/'',/*RedA4*/'',/*RedA5*/'',/*RedA6*/'',/*RedA7*/'',/*RedA8*/'',/*RedA9*/'',/*RedA10*/'']
 var BlueDefault = [/*DefaultBlue*/'',/*BlueA1*/'',/*BlueA2*/'',/*BlueA3*/'',/*BlueA4*/'',/*BlueA5*/'',/*BlueA6*/'',/*BlueA7*/'',/*BlueA8*/'',/*BlueA9*/'',/*BlueA10*/'']
Title Default is just the title of the thing mapped to make things clearer below. It is featured at the top of the interactive legend box. Here, Title Default should be '2014 Gov','2014 Gov','Otter (R)','Balukoff (D)'.
Wincode Default is the relevant Wincode variable from the 2014 ID layer. Here, that's G4_GovGEWi. Put that in the quotes after Default Wincode. When making your own maps, it's never a good idea to start a variable with a number. It's impossible to call it, as far as I know.
RedDefault is the variable for the red candidate's percentage from the 2014 ID layer. Here, that's G4_PCTOtte. Put that in the quotes after Default Red.
BlueDefault is the variable for the blue candidate's precentage from the 2014 ID layer. Here, that's G4_PCTBalu. Put that in the quotes after Default Blue.
We can skip the rest of the defaults, as we are only mapping the top 2 candidates in the 2014.
Next, we add the candidates names to the ColorCandidateDefault fields.
var RedCandidateDefault = [/*DefaultRedCandidateName*/'',/*RedCandidateNameA1*/'',/*RedCandidateNameA2*/'',/*RedCandidateNameA3*/'',/*RedCandidateNameA4*/'',/*RedCandidateNameA5*/'',/*RedCandidateNameA6*/'',/*RedCandidateNameA7*/'',/*RedCandidateNameA8*/'',/*RedCandidateNameA9*/'',/*RedCandidateNameA10*/'']
 var BlueCandidateDefault = [/*DefaultBlueCandidateName*/'',/*BlueCandidateNameA1*/'',/*BlueCandidateNameA2*/'',/*BlueCandidateNameA3*/'',/*BlueCandidateNameA4*/'',/*BlueCandidateNameA5*/'',/*BlueCandidateNameA6*/'',/*BlueCandidateNameA7*/'',/*BlueCandidateNameA8*/'',/*BlueCandidateNameA9*/'',/*BlueCandidateNameA10*/'']
RedCandidateDefault is 'Otter'. BlueCandidateDefault is 'Balukoff'. Type those names inside the quotes in relevant the Default cells. Skip to the StatewidePCT fields.
var RedStatewidePCTDefault = [/*DefaultRedStatewidePCT*/'',/*RedStatewidePCTA1*/'',/*RedStatewidePCTA2*/'',/*RedStatewidePCTA3*/'',/*RedStatewidePCTA4*/'',/*RedStatewidePCTA5*/'',/*RedStatewidePCTA6*/'',/*RedStatewidePCTA7*/'',/*RedStatewidePCTA8*/'',/*RedStatewidePCTA9*/'',/*RedStatewidePCTA10*/'']
 var BlueStatewidePCTDefault = [/*DefaultBlueStatewidePCT*/'',/*BlueStatewidePCTA1*/'',/*BlueStatewidePCTA2*/'',/*BlueStatewidePCTA3*/'',/*BlueStatewidePCTA4*/'',/*BlueStatewidePCTA5*/'',/*BlueStatewidePCTA6*/'',/*BlueStatewidePCTA7*/'',/*BlueStatewidePCTA8*/'',/*BlueStatewidePCTA9*/'',/*BlueStatewidePCTA10*/'']
Next, we'll add the statewide winning percent for both candidates. This isn't in the shapefile, but is in my underlying spreadsheet. Otter won with 53.5% of the vote; Balukoff received 38.6%.
DELETE the quotes and type 53.5 after DefaultRedStatewidePCT. Note: there's no percentage mark here - we want a real number. DELETE the quotes and type 38.6 after the same Blue variables. Again, we'll skip the other colors.
/Variable for Precinct/Geo Name. Likely the same for each unless there's multiple contests in menu
 var PrecinctDefault = [/*DefaultPrecinctName*/'',/*PrecinctNameA1*/'',/*PrecinctNameA2*/'',/*PrecinctNameA3*/'',/*PrecinctNameA4*/'',/*PrecinctNameA5*/'',/*PrecinctNameA6*/'',/*PrecinctNameA7*/'',/*PrecinctNameA8*/'',/*PrecinctNameA9*/'',/*PrecinctNameA10*/'']

 //Total Precinct Votes for each Precinct/Geo. Likely the same for all unless multiple contests - Variable
 var TotalVotesDefault = [/*DefaultTotPrecVotes*/'',/*TotPrecVotesA1*/'',/*TotPrecVotesA2*/'',/*TotPrecVotesA3*/'',/*TotPrecVotesA4*/'',/*TotPrecVotesA5*/'',/*TotPrecVotesA6*/'',/*TotPrecVotesA7*/'',/*TotPrecVotesA8*/'',/*TotPrecVotesA9*/'',/*TotPrecVotesA10*/'']

 //Total Statewide Votes for each contest. Likely the same for all unless multiple contests - Number - change from 0
 var StatewideVotesDefault = [/*DefaultTotSWVotes*/0,/*TotSWVotesA1*/0,/*TotSWVotesA2*/0,/*TotSWVotesA3*/0,/*TotSWVotesA4*/0,/*TotSWVotesA5*/0,/*TotSWVotesA6*/0,/*TotSWVotesA7*/0,/*TotSWVotesA8*/0,/*TotSWVotesA9*/0,/*TotSWVotesA10*/0]

//Ancestry for Ancestry maps; Wincode for Wincode maps. More to come.
 var relevanttypeDefault = [/*DefaultMapType*/'Wincode',/*MapTypeA1*/'',/*MapTypeA2*/'',/*MapTypeA3*/'',/*MapTypeA4*/'',/*MapTypeA5*/'',/*MapTypeA6*/'',/*MapTypeA7*/'',/*MapTypeA8*/'',/*MapTypeA9*/'',/*MapTypeA10*/'']
-PrecinctDefault is the variable for the precinct name from the 14 ID layer. That's NAME10. Type NAME10 inside the quotes after DefaultPrecinctName.
-TotalVotesDefault is the total votes cast in the precinct from the 14 ID layer. That's G4_GovTota. Type G4_GovTota inside the quotes after DefaultTotalVotesDefault.
-Total Statewide Votes is the total statewide votes cast. That's not in the data, but is a number - 439,830. Type 439830 over the zeroes in Default.
-relevanttypeDefault DefaultMapType should be Wincode.
This defined the default map, which is at [0][0][0] in the mega matrix. Next, we need to define the non-default maps. Since the relevant Layer Types are in A1, A2 and A3, in theory, we need to edit the variables for A[1], A[2] and A[3]. However, because the default map is also a Wincode map, we needn't edit A[1] - the default variables for A[1] repeat the default.
Scroll down to TitleA[2]. Because A2 is going to be a red map, we only need to fill in a handful of largely red-related variables, only in the Default coulmn:
-TitleA[2] Default should be 'Otter (R)'.
-RedA[2] Default should be changed to 'G4_PCTOtte'.
-RedCandidateA[2] Default should be changed to 'Otter'.
-RedStatewidePCTA[2] Default should be changed to the number 53.5 (no quotes).
-PrecinctA[2] Default should be changed to 'NAME10'.
-TotalVotesA[2] Default should be changed to 'G4_GovTota'.
-StatewideVotesA[2] Default should be changed to 439830.
-clickedLayerA[2] Default should be 'R' for red.
-relevanttypeA[2] Default should be 'Wincode'.
Next, scroll down to Title A[3]. Again, because it's a blue map, we only need to fill in a handful of variables only in the Default column:
-TitleA[3] Default should be 'Balukoff (D)'.
-BlueA[3] Default should be changed to 'G4_PCTBalu'.
-BlueCandidateA[3] Default should be changed to 'Balukoff'.
-BlueStatewidePCTA[3] Default should be changed to the number 38.6 (no quotes).
-PrecinctA[3] Default should be changed to 'NAME10'.
-TotalVotesA[3] Default should be changed to 'G4_GovTota'.
-StatewideVotesA[3] Default should be changed to 439830.
-clickedLayerA[3] Default should be 'B' for blue.
-relevanttypeA[3] Default should be 'Wincode'.
Save your work. That's it. If you've done thing correctly, you should have inputted the data necessary to make a map. All you need to do is add this code to your website. How to do that will depend on the website. Once that's done, it should look something like this.
That's it for this tutorial. Part 3 will briefly discuss troubleshooting. Then, in Part 4, we'll make a map with multiple Wincode layers.
