Alaska Presidential Results by County Equivalent, 1960-2016
Unlike the other 49 states, Alaska usually doesn't report its election results by counties. That's not because Alaska doesn't have counties - they're called Boroughs, with the Unorganized Borough broken up by the U.S. Census Bureau into component Census Areas. Instead, Alaska traditionally reports its election day results by precinct and its absentee, question and early votes by House District. Because Alaska House Districts are redistricted every 10 years (or sometimes even more often), this does not allow for easy analysis of trends between cycles. For example, even the 2012 HD map is different from the 2016 HD map due to a successful legal challenge to the 2012 map - which makes trend analysis difficult.
To make matters worse, as I stated above, absentee, question and early votes are only reported by HD, which often cross county equivalent lines (even a few precincts do, but quite often, very few people actually live in the part outside of the main county equivalent). Thus, every estimate of the total vote by CE is just that - an estimate.
I've attempted to estimate the Alaska presidential vote by county equivalent for all cycles since statehood (1960-2016). To do this, I weighted the absentee, question and early vote to reflect differences in the county equivalents' election day percentages of the vote and assumed that relative turnout in each county equivalent HD part was uniform with election day. In other words, if the Mat-Su Borough portion of an HD it shared with Anchorage voted 10 points more R than the Anchorage portion on election day, this difference was taken into account when allocating the absentee, early and questioned vote.
Overview
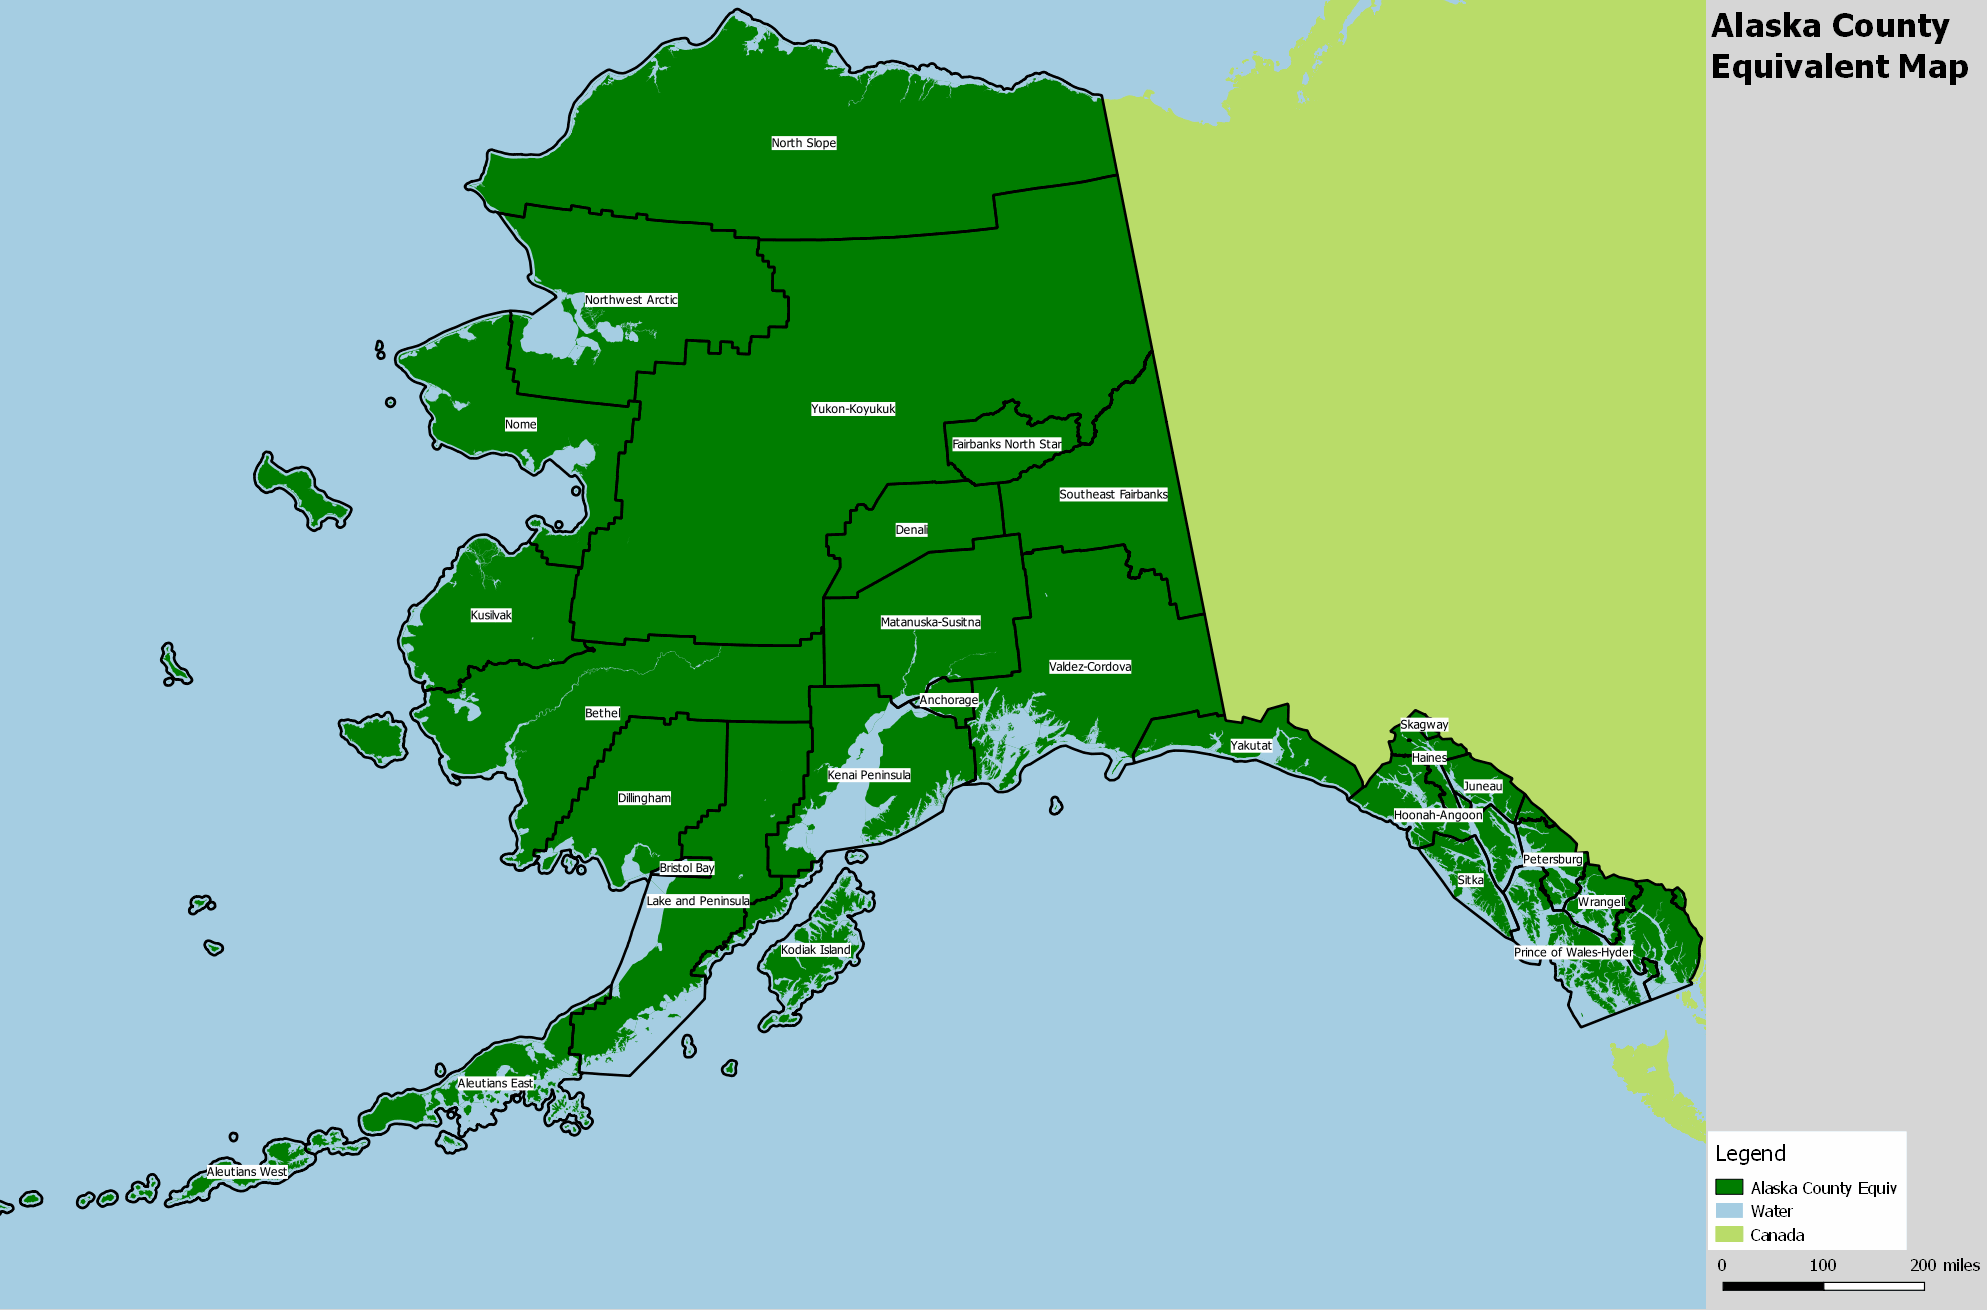
Alaska is currently divided into 29 Boroughs and Census Areas, ranging from the Municipality of Anchorage (with about 40% of the state's population) to Anchorage's exurban Matanuska-Susitna Borough to the City and Borough of Juneau to smaller Census Areas like Nome and Bethel. In general, the two boroughs surrounding Anchorage, Mat-Su and Kenai Peninsula, have traditionally been the Republican heartland of Alaska, while Democrats tend to live in rural areas and, more recently, the capital of Juneau.
Here is a map of the current boundaries of Alaska's county equivalents:

The unlabeled borough in the far Southeast panhandle is Ketchikan Gateway Borough. The notch to the top is the Hyder part of the Prince of Wales-Hyder Census Area.
The Overview GIF
Here's a gif showing the estimated weighted Presidential election results for every cycle from statehood to present, using the current county equivalent lines. Note that, for now, the 2004 numbers are of the election day vote only, as I'm still struggling to figure out how Alaska reported its first presidential cycle of early votes.
Don't worry if the gif goes by too fast. All of the maps will be replicated below.
Alaska Presidential Electoral History, 1960-2016
1960 - Nixon Ekes Out a Win
Let's start at the very beginning, with the very close presidential election in the year after Alaska gained statehood, 1960:
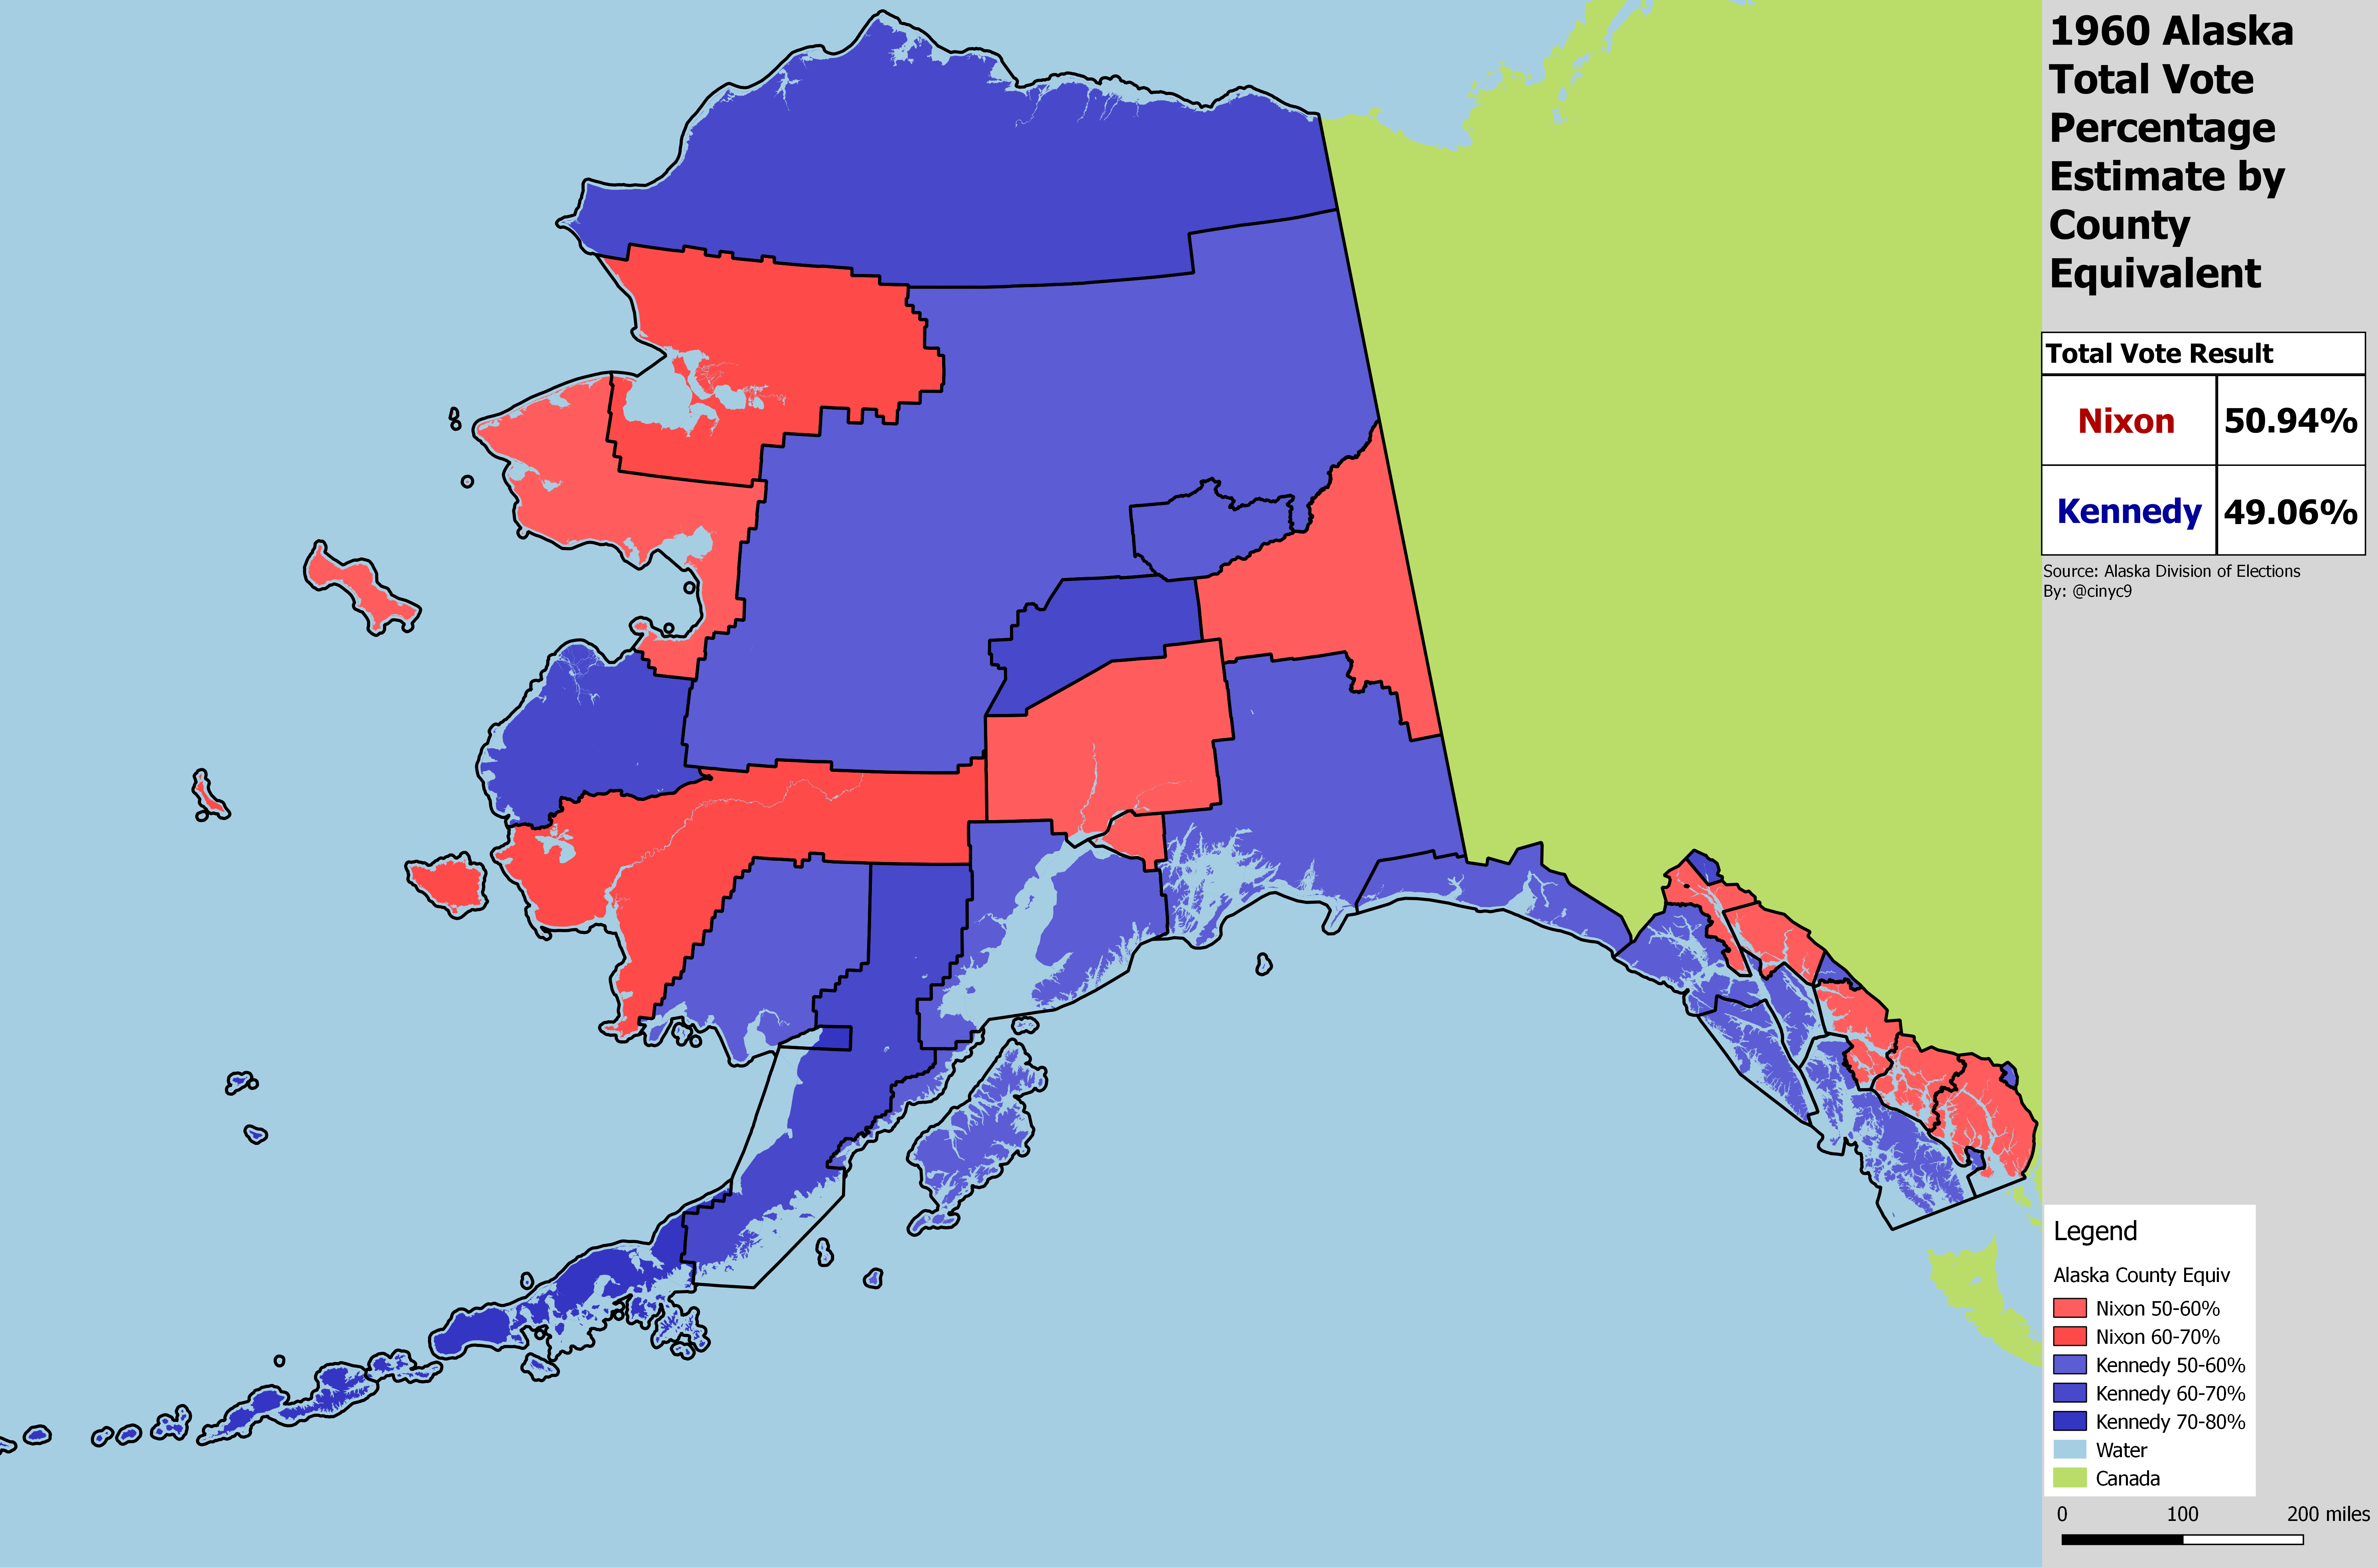
The 1960 election in Alaska was very close, with Nixon winning by less than a point. His narrow margin of victory was provided by what now would be somewhat strange places - Bethel, Nome and the more urban parts of Southeast Alaska. He also won the city of Anchorage and its Mat-Su neighbor (which, back in 1960 was neither large nor much of an exurb), but not Kenai Peninsula Borough.
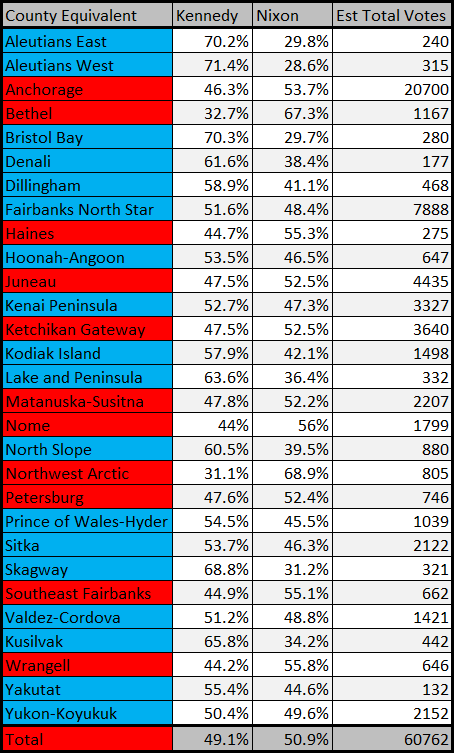
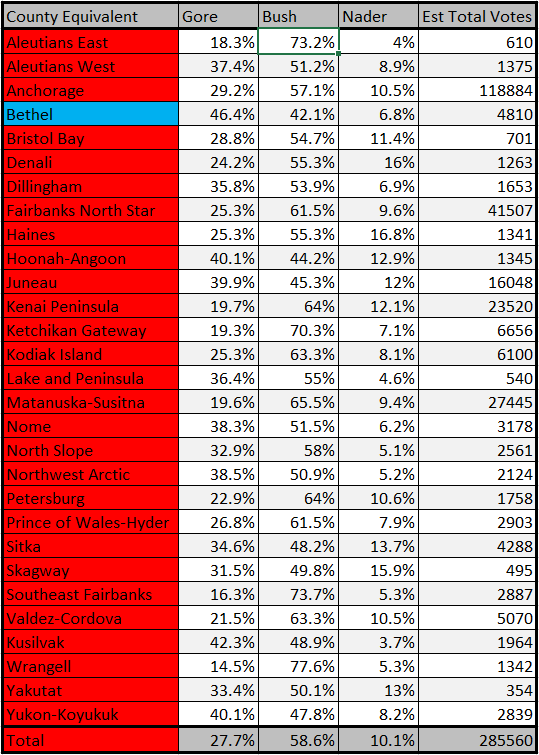
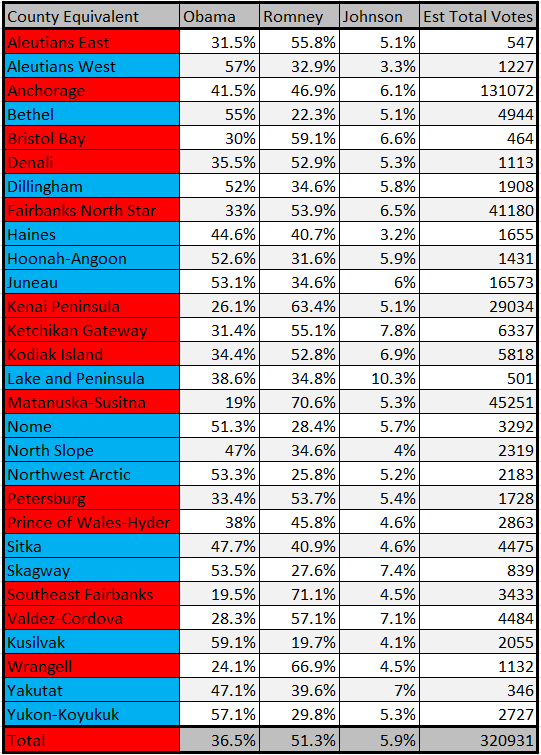
Since the data's generally not available on the Internet, below is a chart showing the 1960 estimated weighted results by county equivalent for each area. Note that the Kusilvak Census Area is listed alphabetically in the Ws because it used to be known as Wade-Hampton:
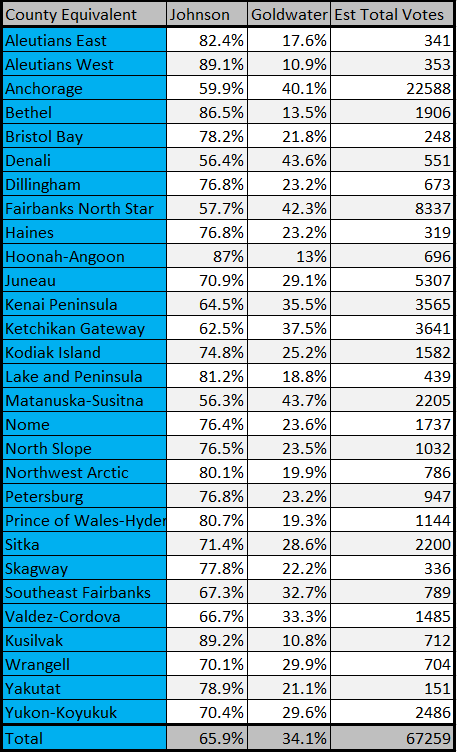
1964 - A Johnson Landslide
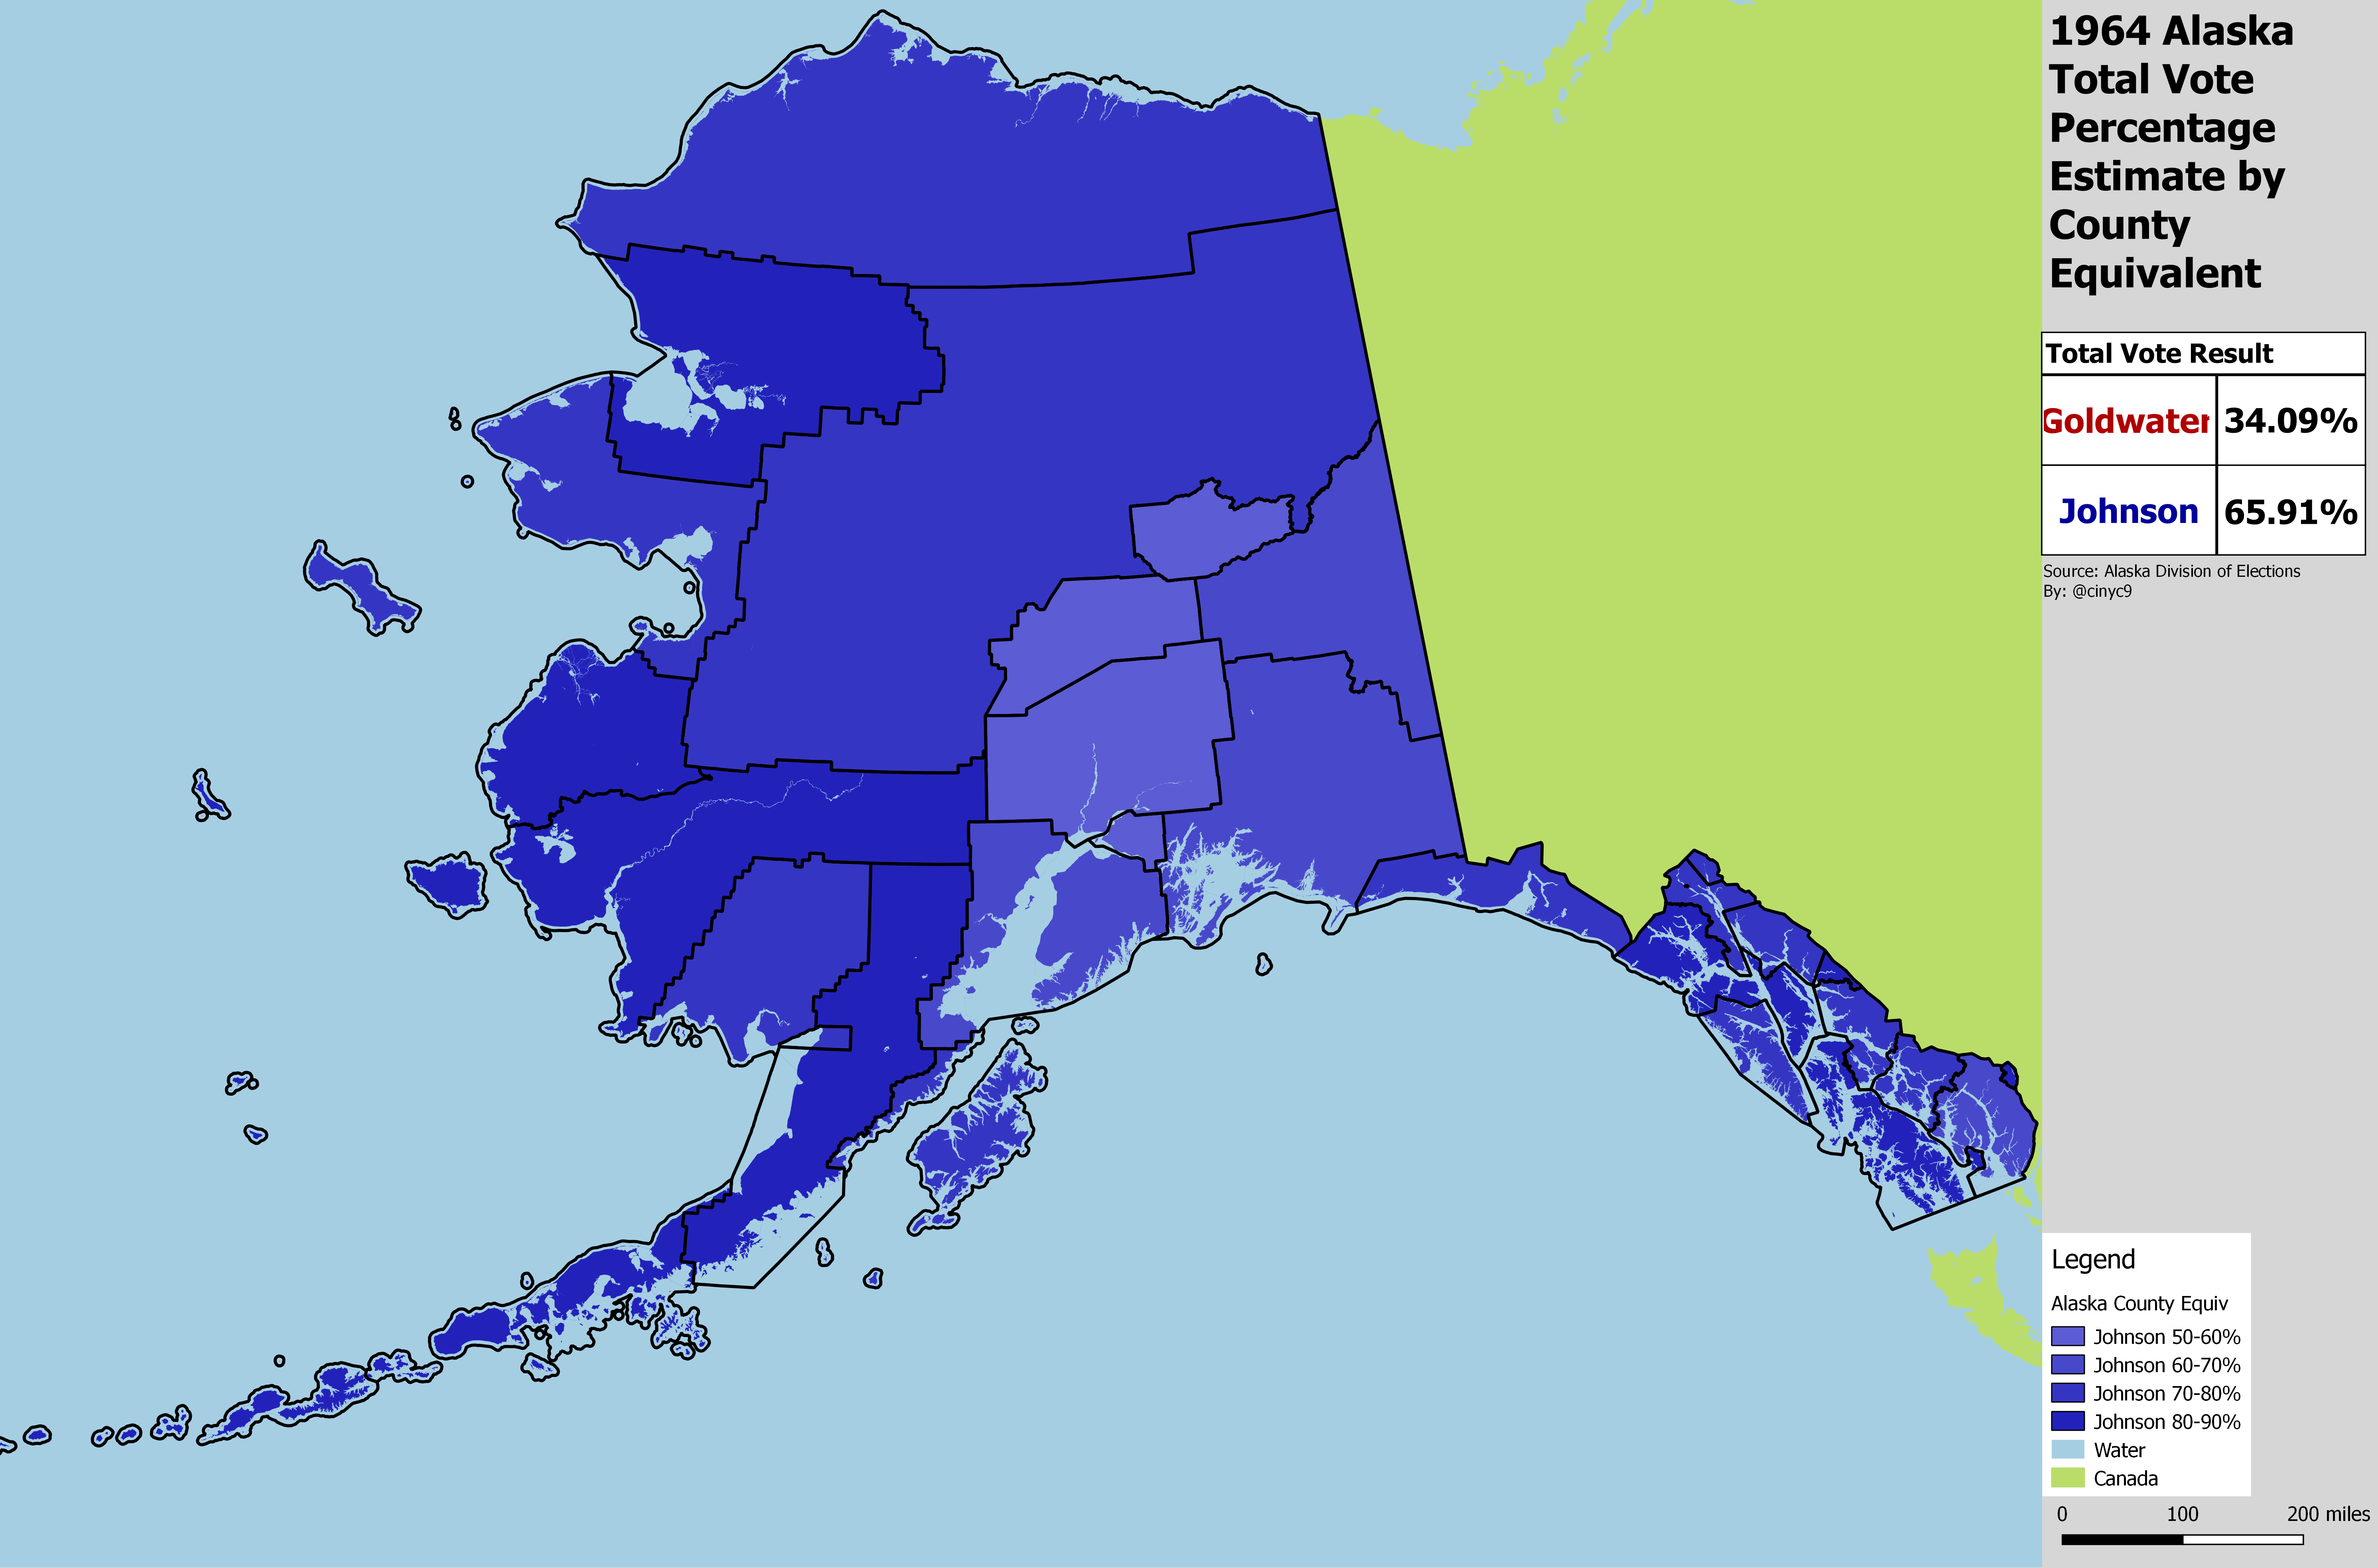
Like in much of the rest of the country, Lyndon Johnson swept through Alaska, winning every county equivalent over Barry Goldwater. Because of this sweep, Democrats have won every Alaska county equivalent at least once.
The by-CE chart doesn't show a ton of variation. Goldwater's best showing was in current-day Mat-Su, Denali and Fairbanks-North Star Boroughs. He also barely cracked 40% in Anchorage:
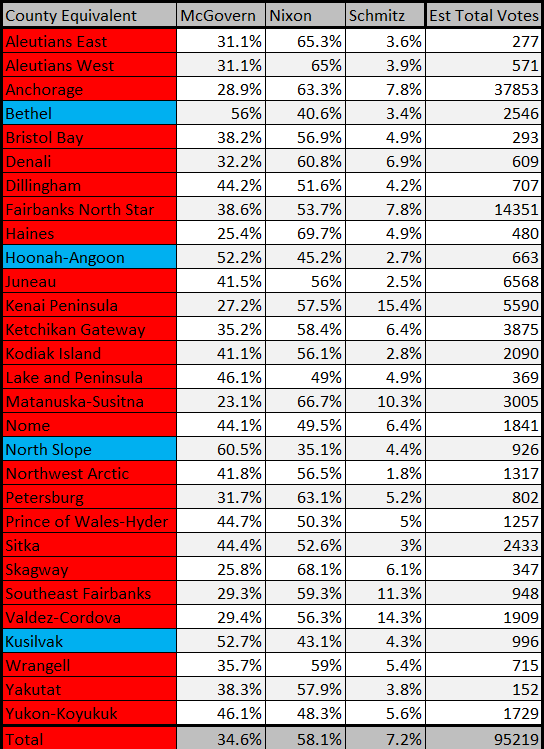
1968 - The Return of Nixon
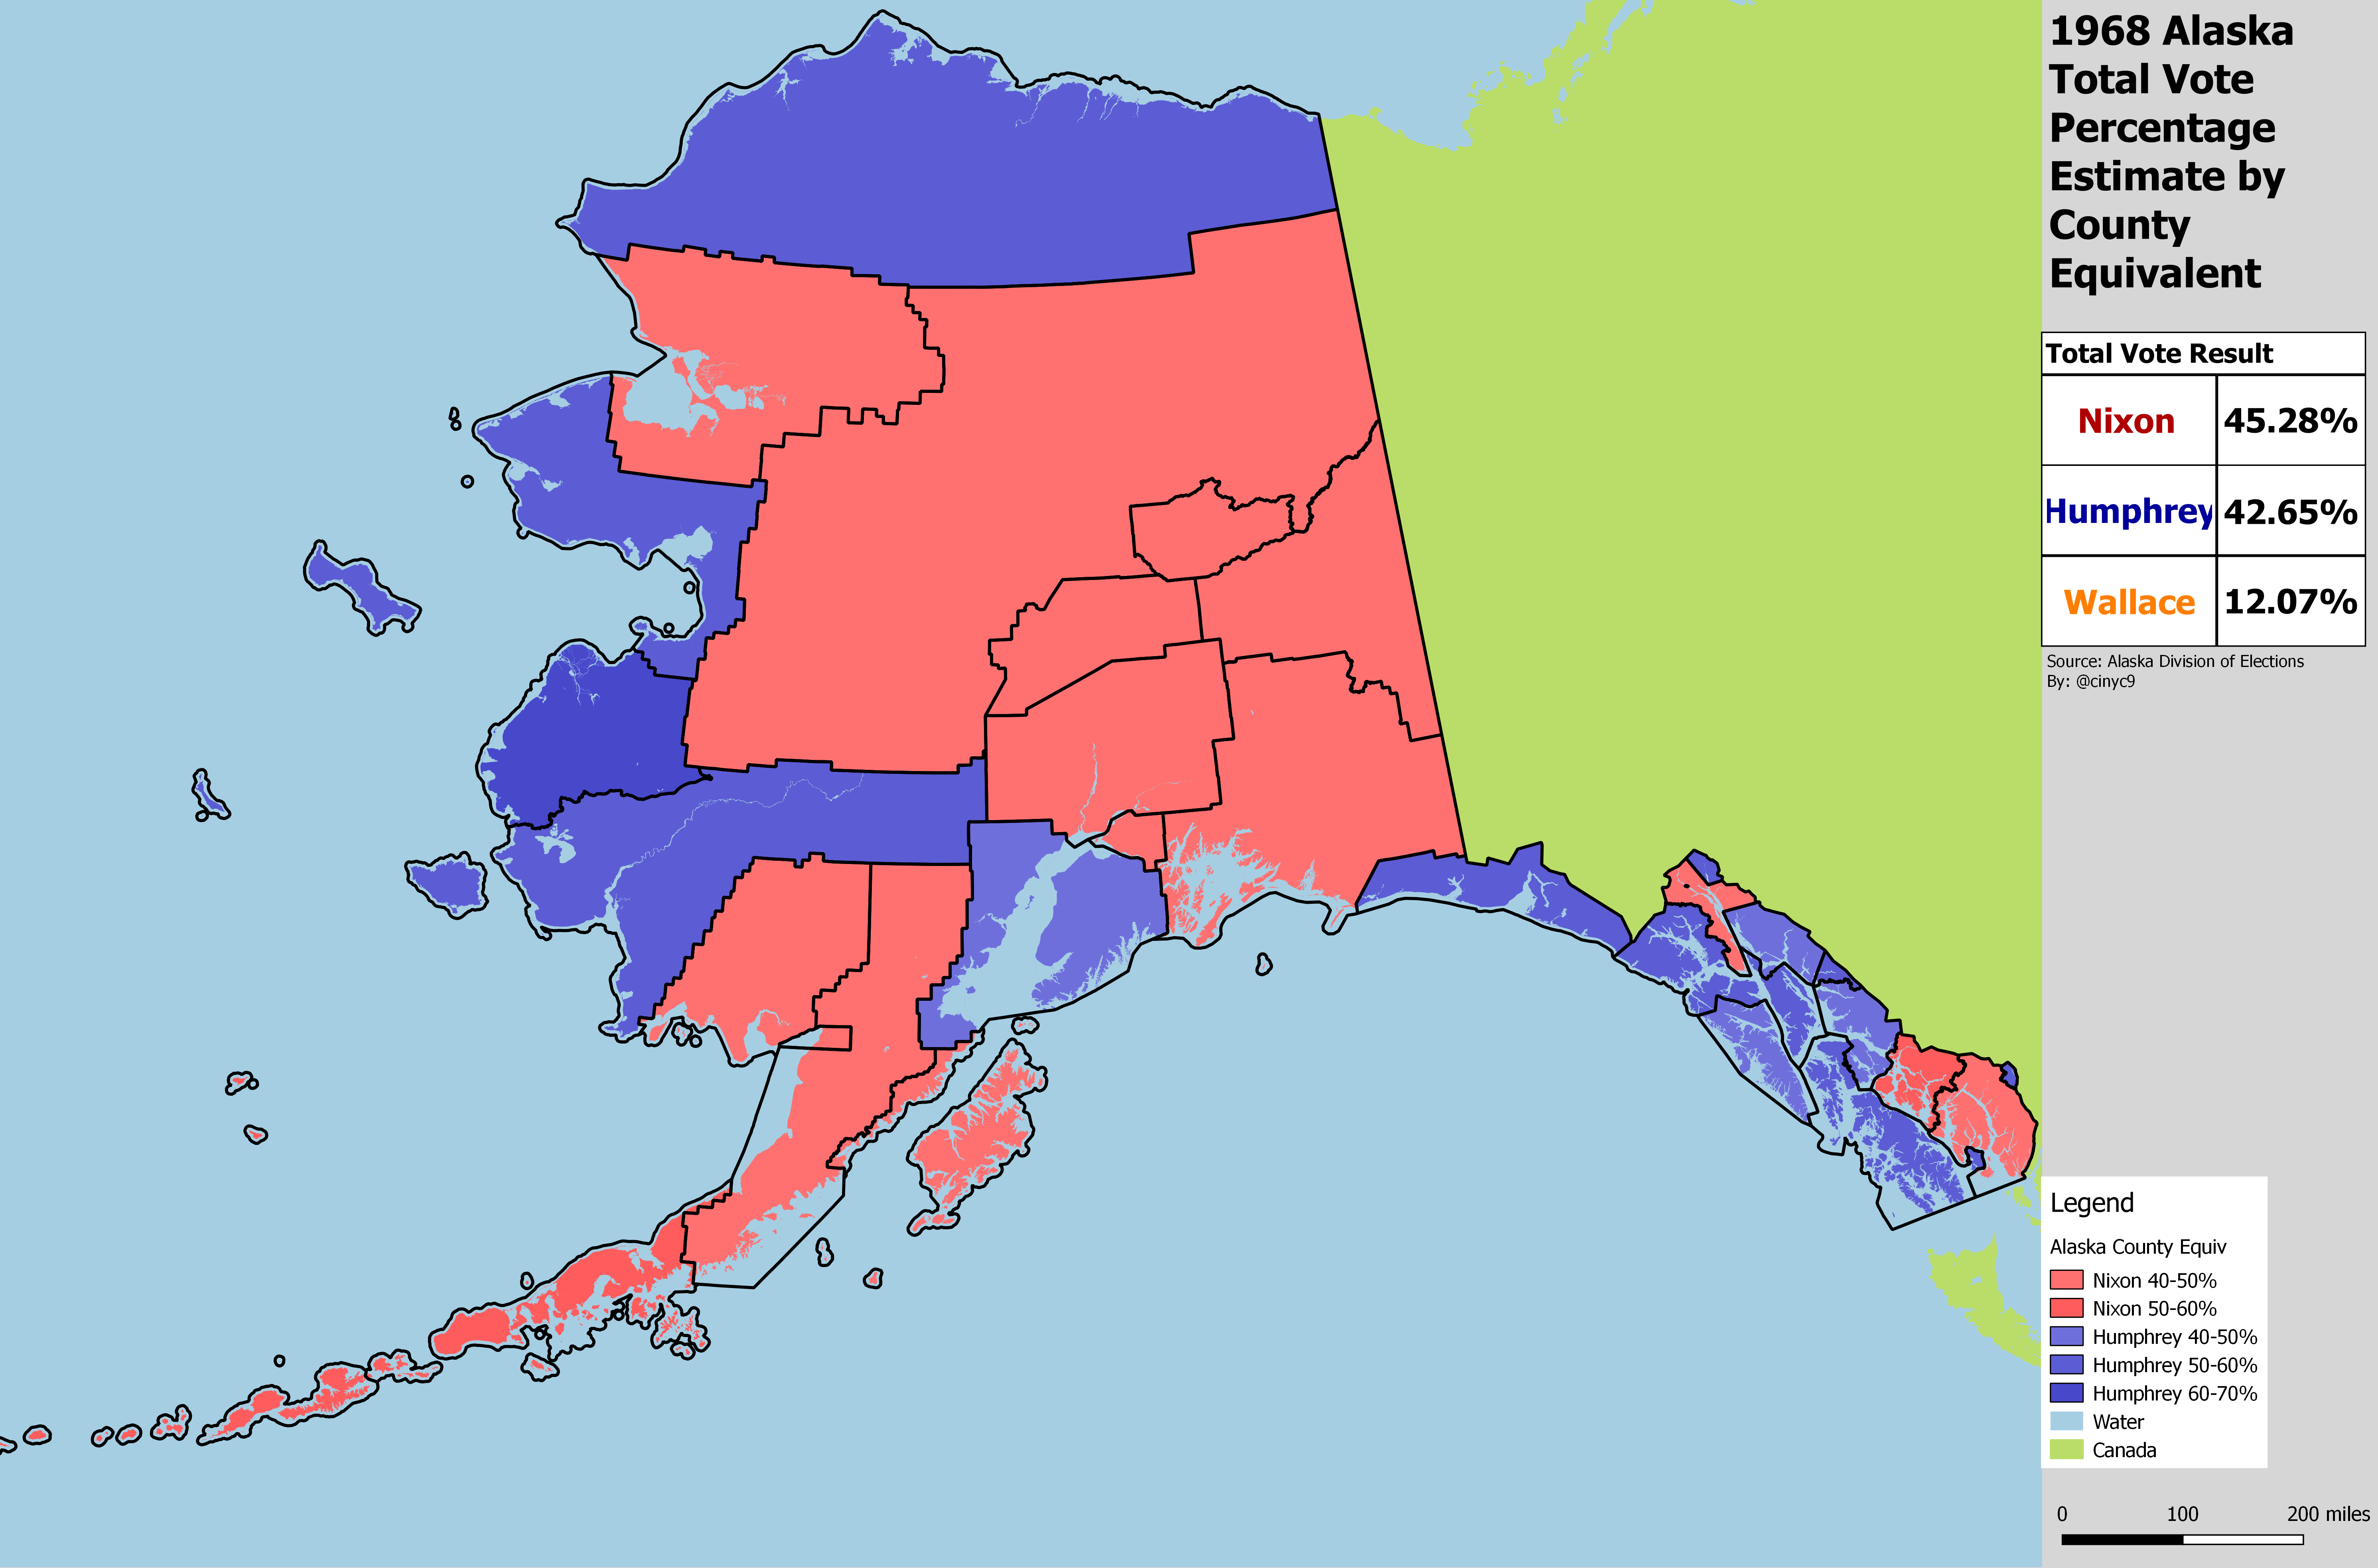
Richard Nixon won a surprisingly close race in 1968, beating Hubert Humphrey in Alaska by about 3 points. This might have been due to George Wallace winning some of the vote on the right - he received about 12% of the vote, winning 2 Interior Alaska precincts in the process - Kenny Lake and Dot Lake.
On the county equivalent level, Kenai Peninsula Borough finally joined its current ideological cousin, Mat-Su, in voting for Nixon, while Juneau started its Democratic trend.
The chart shows Wallace doing best in traditional Republican areas, like Southeast Fairbanks and Kenai Peninsula. Anchorage voted almost exactly like the rest of the state:

Note that there were about 1900 reported federal-only votes in 1968 that were not allocated by precinct or House District. I did not try to allocate to the various county equivalents. They broke more pro-Nixon than the rest of the vote - but I doubt they would push any of the Humphrey county equivalents over to Nixon.
1972 - Nixon Wins Alaska for a Third Time
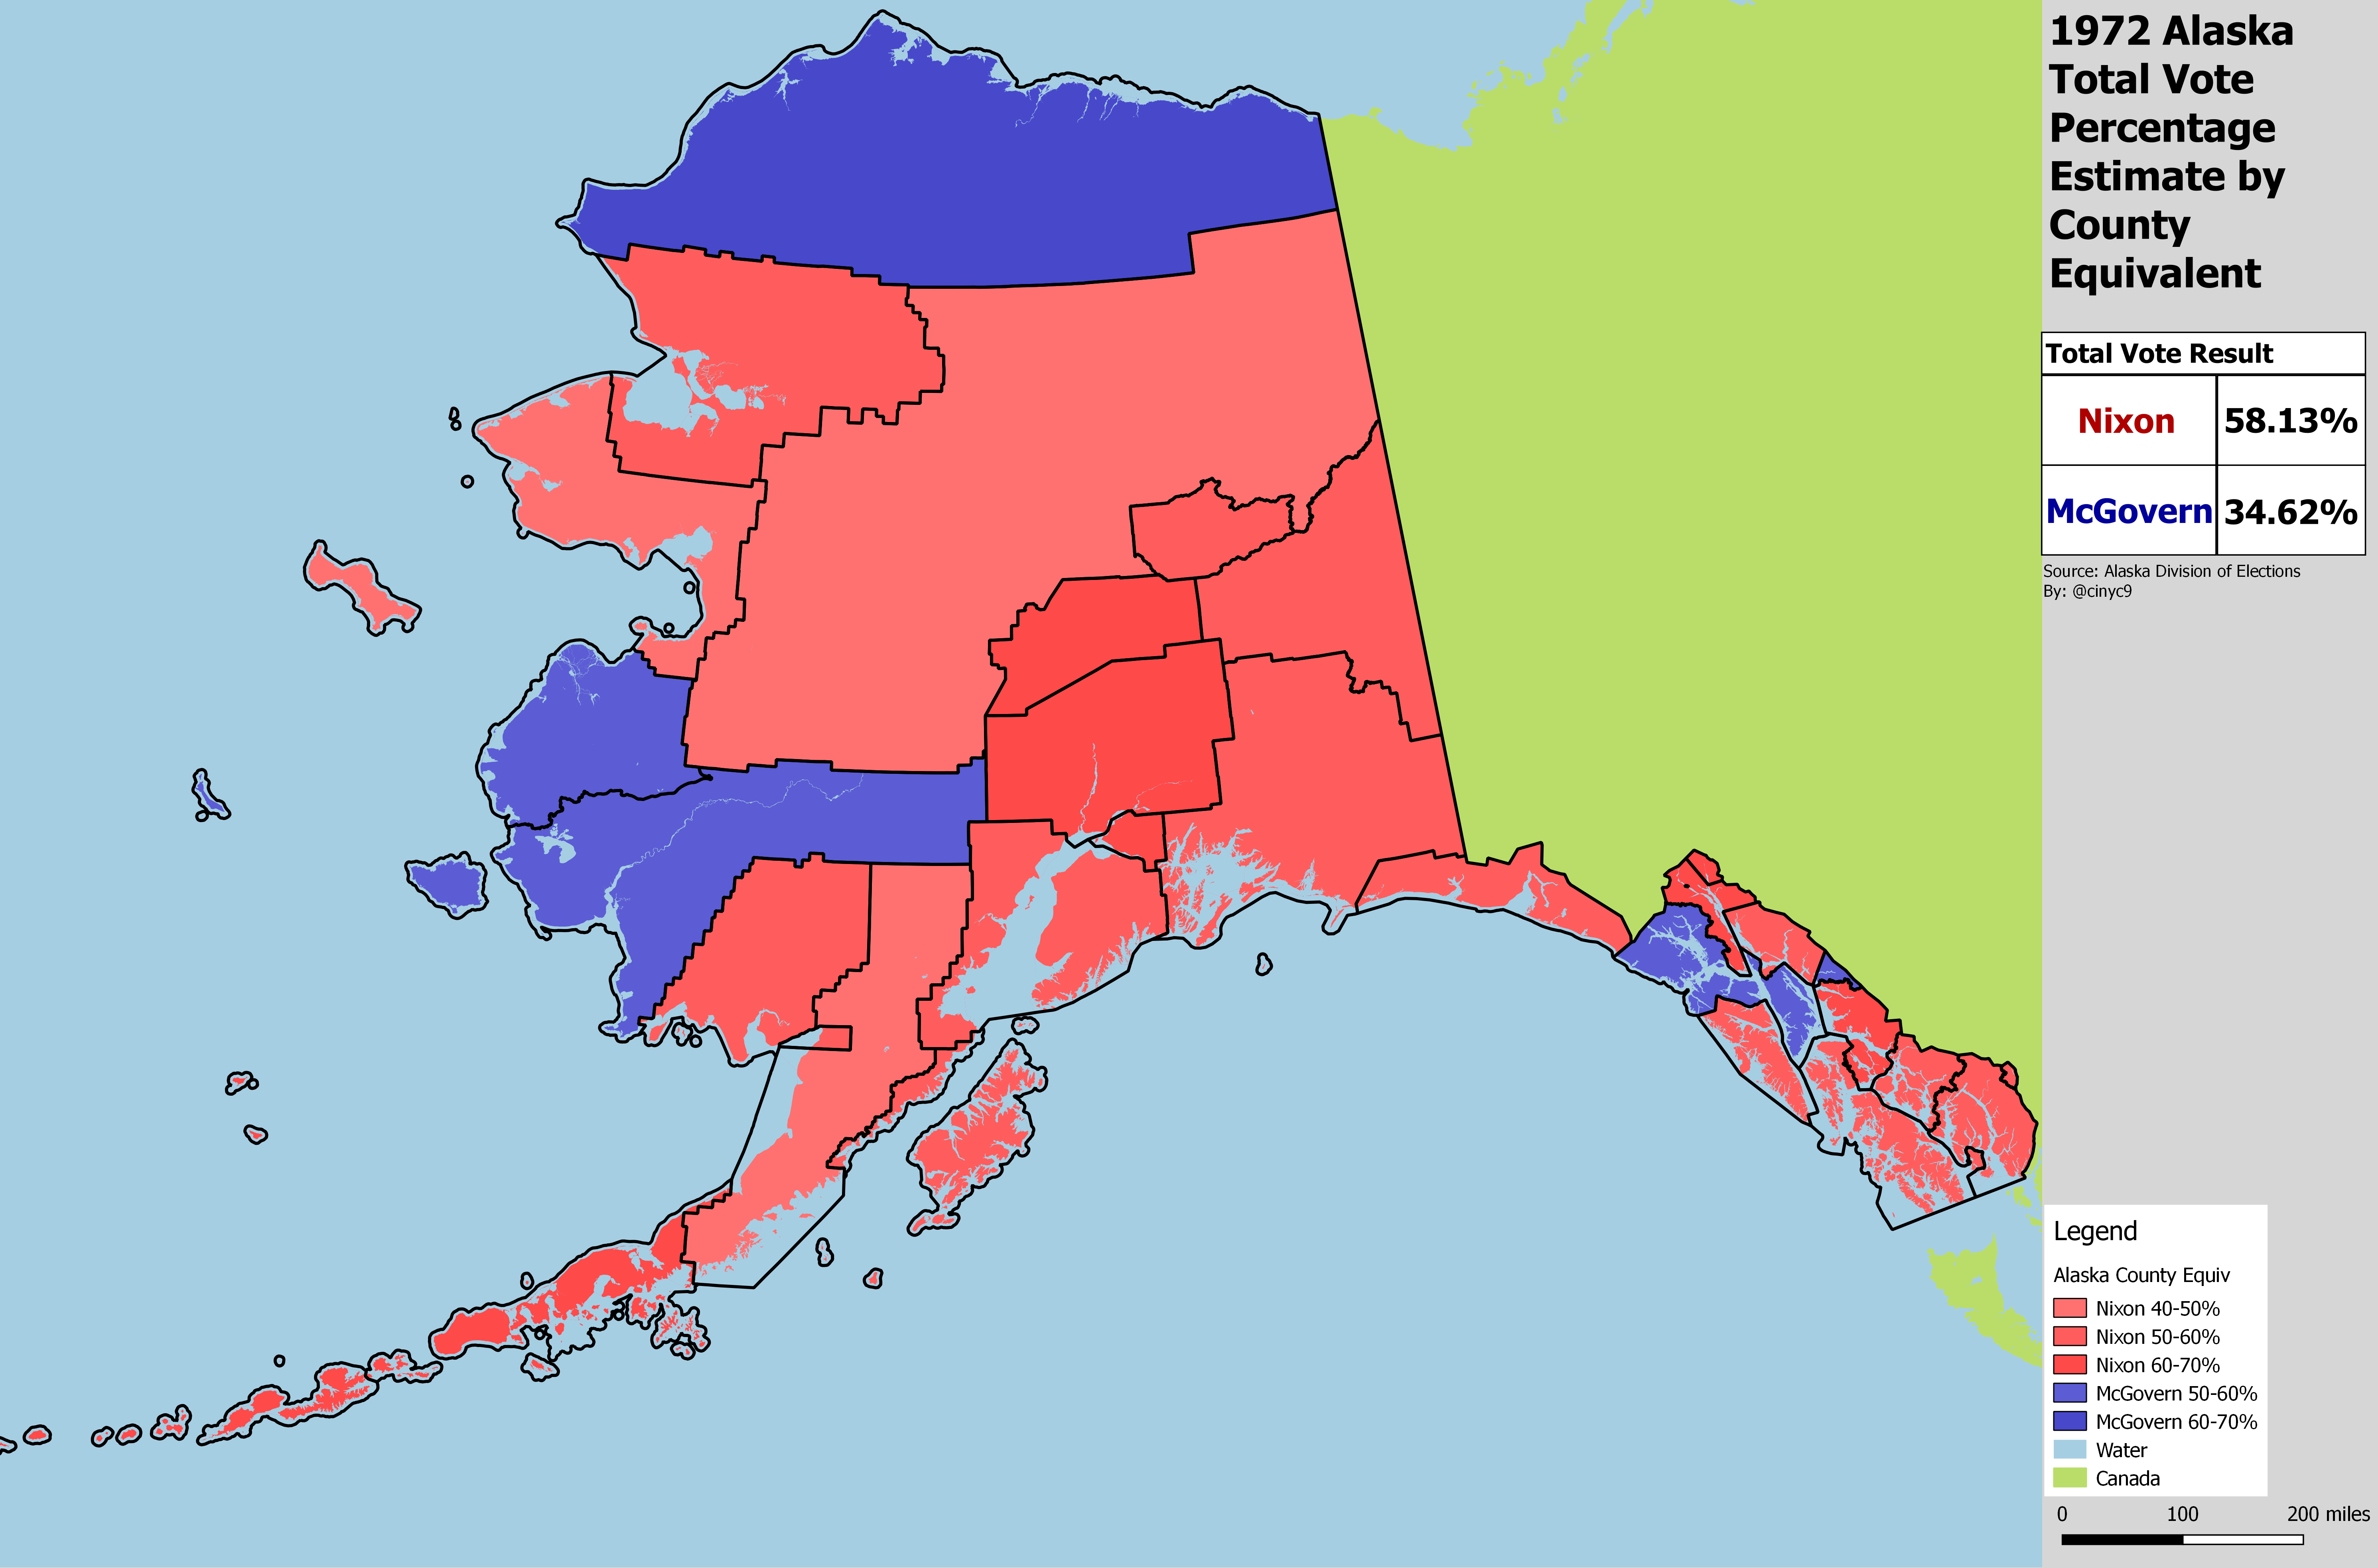
Nixon handily won reelection in 1972, including in Alaska. Thus, he went 3 for 3 in Alaska's Presidential elections. This was the first cycle where a Republican swept most of the Alaska county equivalents - a pattern that would generally continue for the next few decades.
John Schmitz ran as the American Independent party candidate, and was on the ballot in Alaska. He did not fare as well as George Wallace, but won a respectable 7.2% of the total vote, again performing best in what today are traditionally Republican-leaning areas. He won 1 precinct, Stebbins in the Nome Census Area. I don't know why - this could be a mistake in the official results.
The county equivalent results chart for 1972 shows Nixon winning all but 4 county equivalents in this election. Anchorage voted a bit to the right of the state as a whole, and Kenai continued its rightward tilt. Mat-Su was still relatively small, but almost as equally as Republican as today.
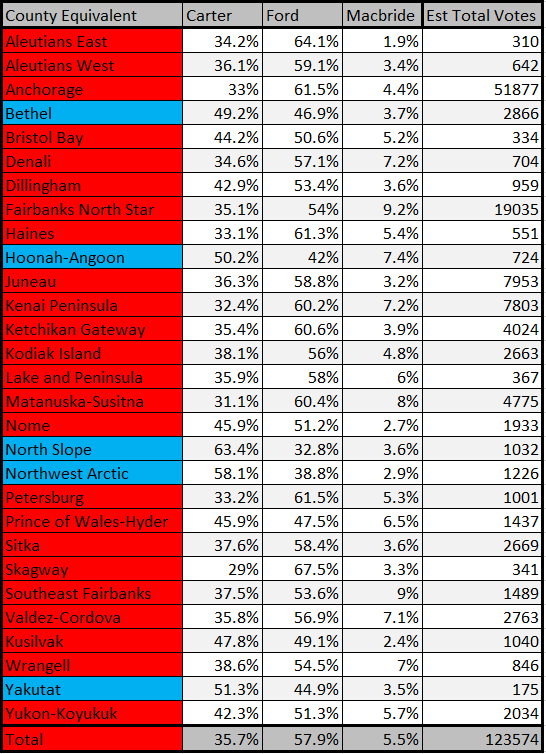
1976 - Ford Beats Carter
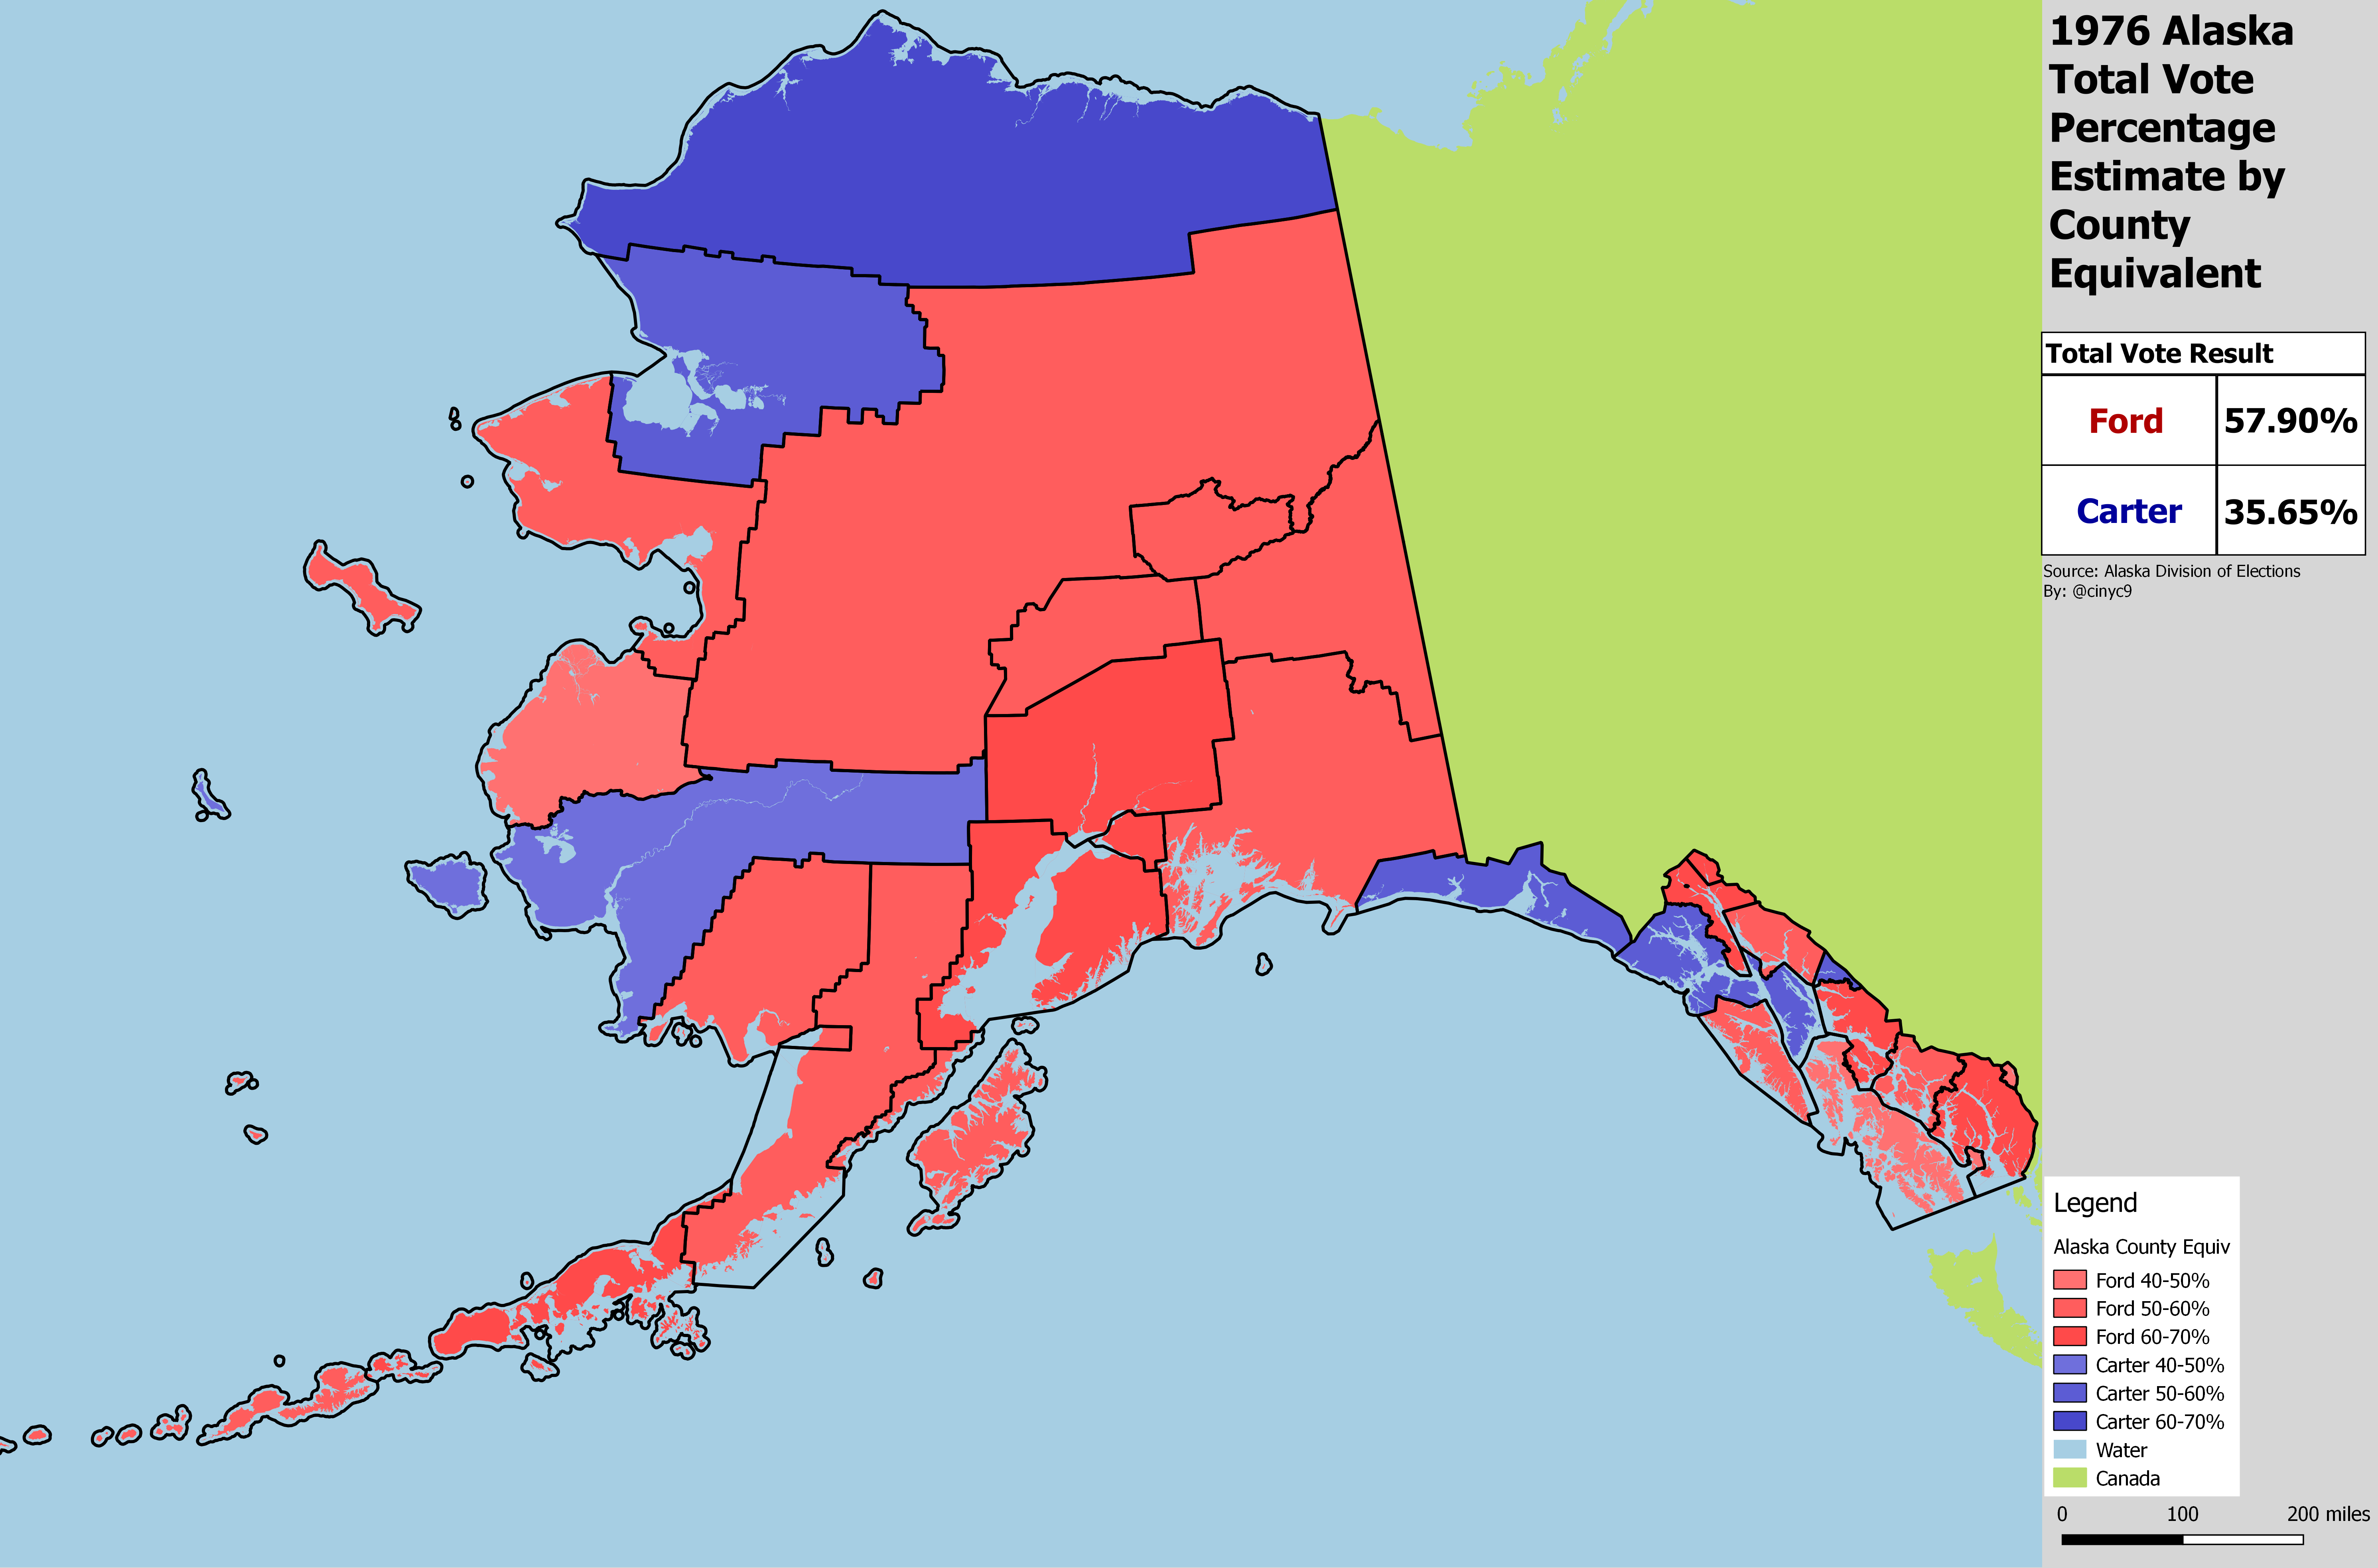
If it were up to Alaska, Gerald Ford would have remained President in 1977. Nationwide, Carter won the popular vote by 2 points, 50.1%-48.0%. In Alaska, it wasn't even close - Ford won the state by 22 points. Libertarian Roger MacBride took 5.5% of the Alaska vote, winning no precincts.
The 1976 map was almost identical to 1972, except Ford lost NW Arctic Borough and Yakutat while eking out a small win in the Kusilvak Census Area. Again, Anchorage voted to the right of the state, while Kenai Peninsula Borough finally caught up to its ideological brother, Mat-Su, which still wasn't nearly as populated as it is today. Exurban growth was yet to come.
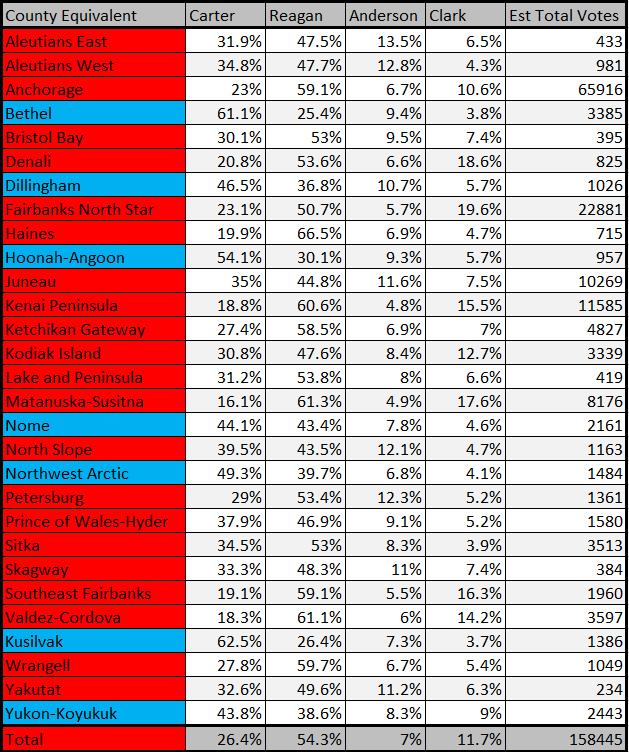
1980 - The Reagan Revolution Resounds in Alaska
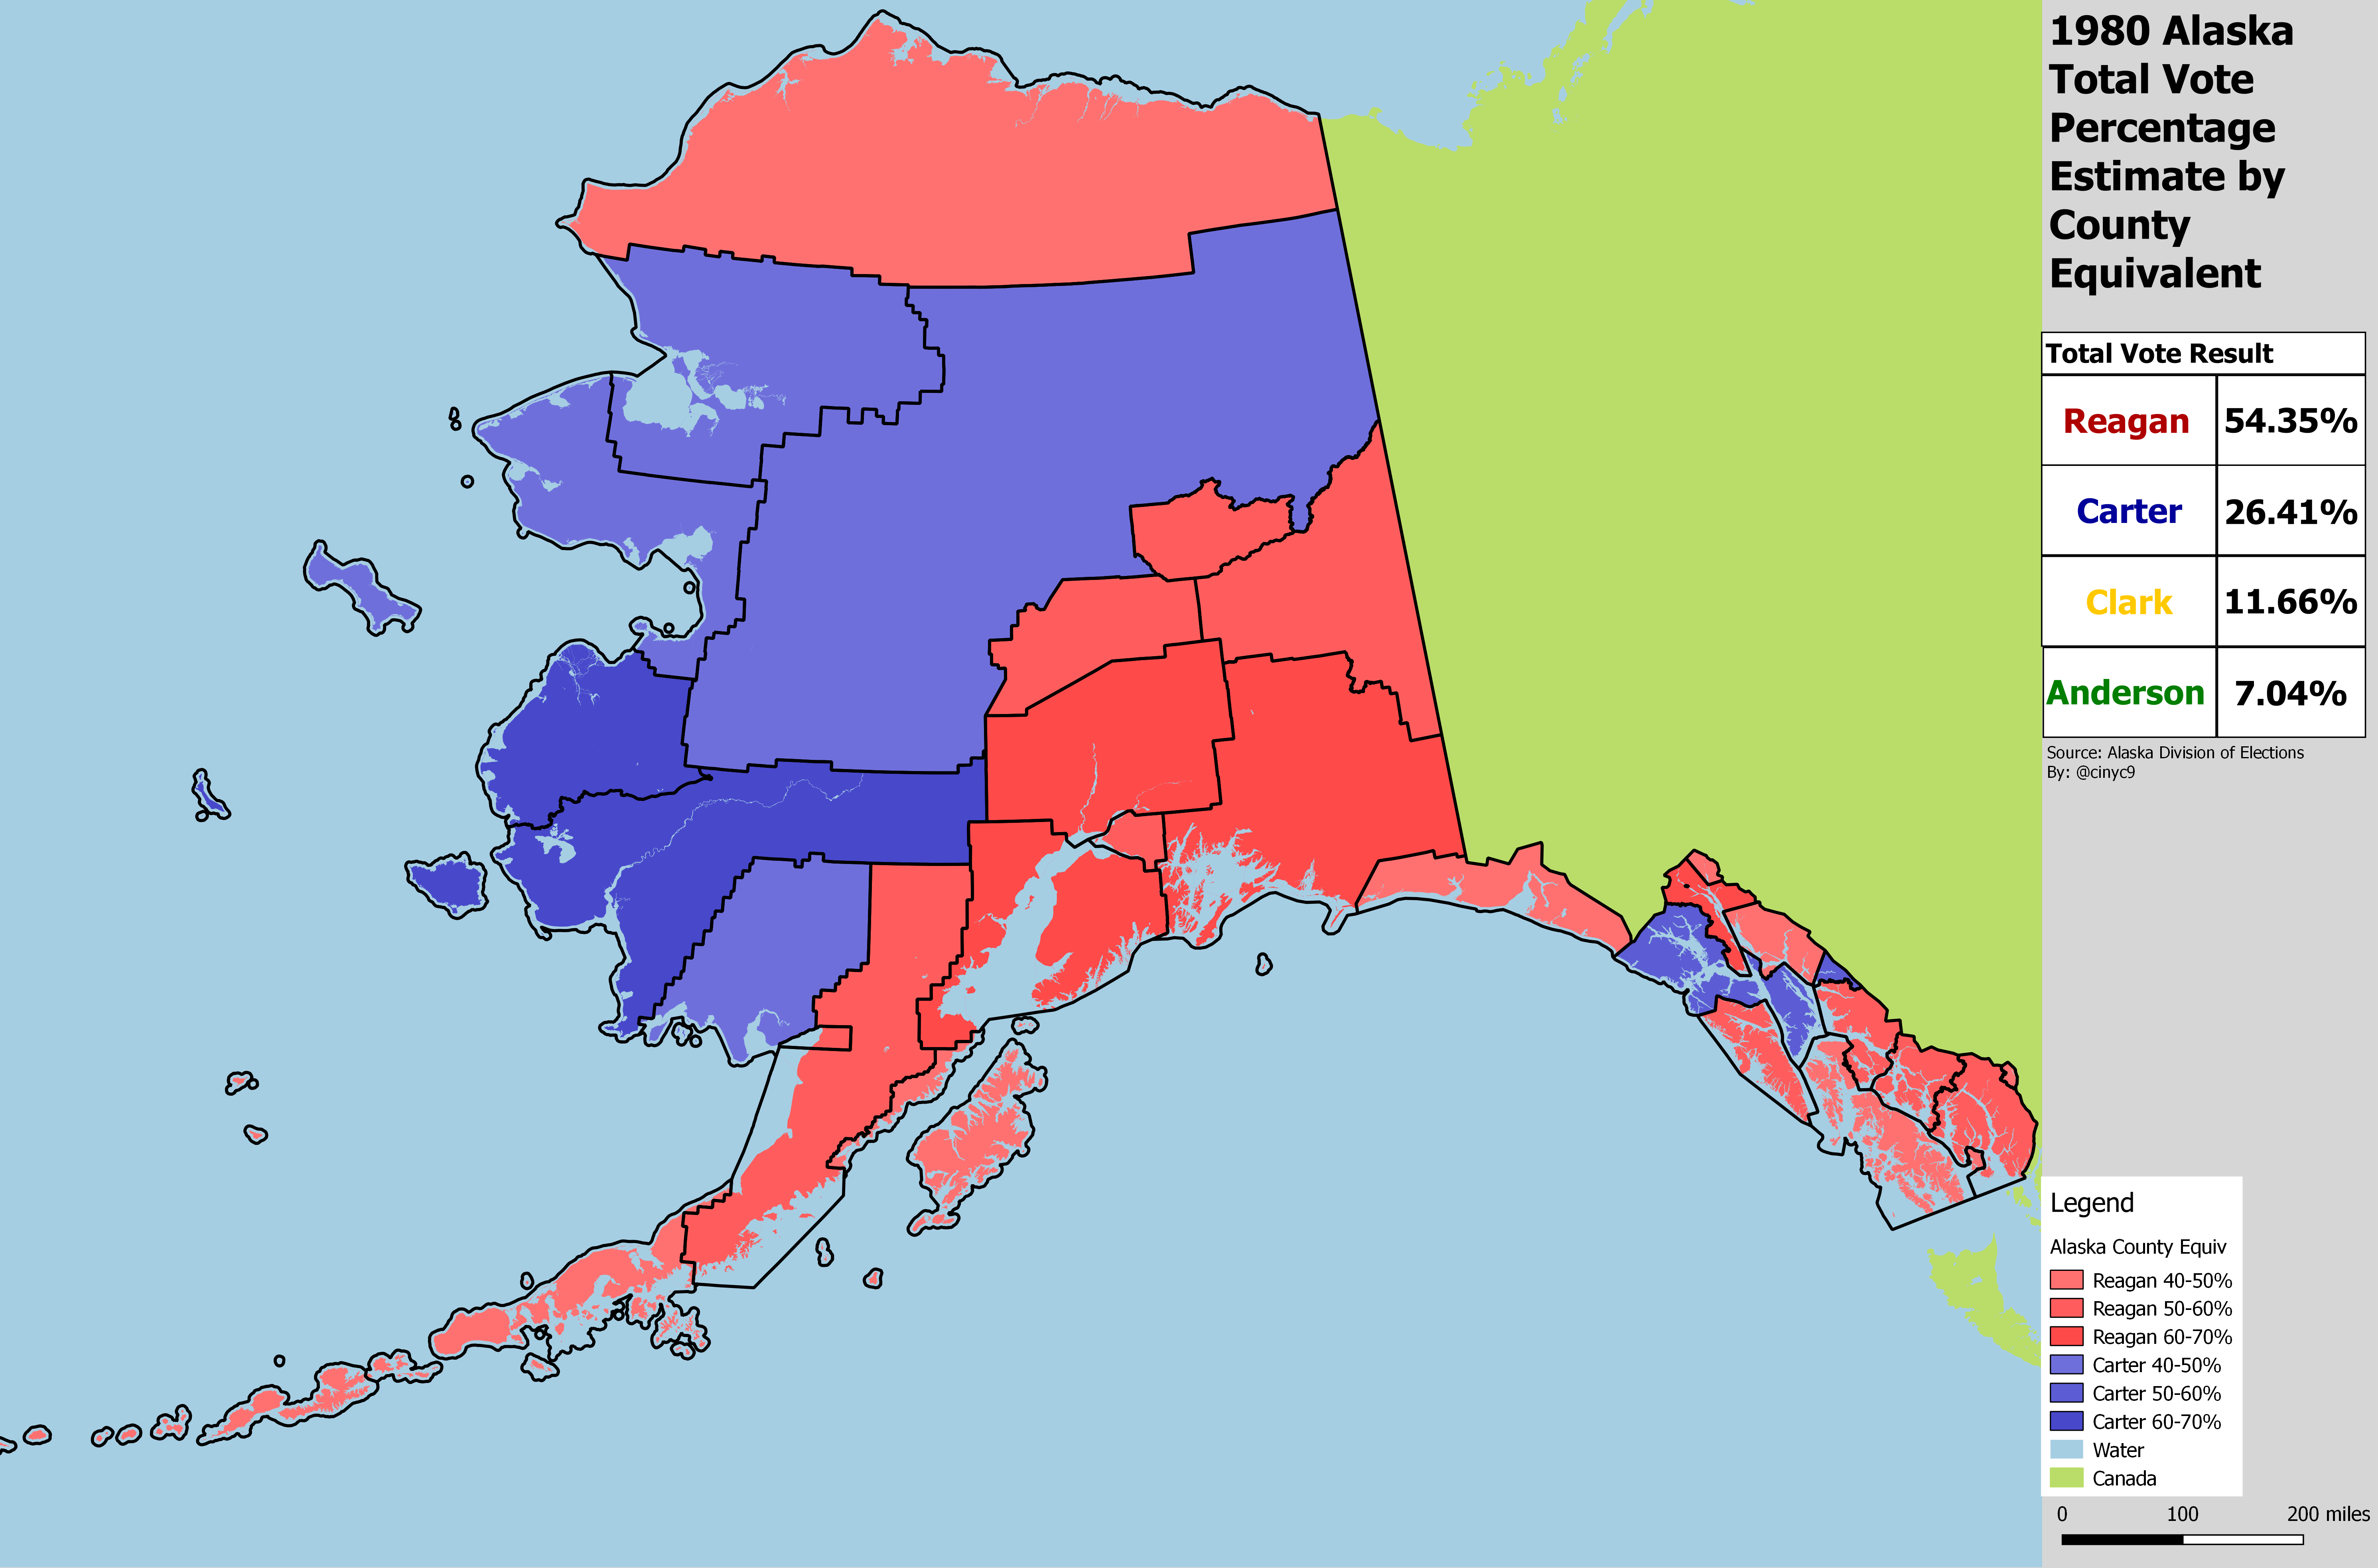
The 1980 Presidential Election in Alaska was a 4-way race, with Libertarian Ed Clark, running on a ticket with billionaire David Koch, garnering 11.7% of the vote. Independent John Anderson also took 7%. This allowed Ronald Reagan to beat Jimmy Carter by 28 points, despite only getting 54.4% of the vote. Clark won 2 Interior Alaskan precincts, Manley Hot Springs and Circle. Anderson won Port Alexander in the Southeast by 1 vote.
Despite the Reagan blowout, Carter won many of the rural county equivalents. Sometimes, rural Alaska has been incumbent-friendly regardless of the President's party. Again, Anchorage voted slightly more Republican than the rest of the state, and the Mat-Su/Kenai Republican bromance continued. Anderson's best showing was generally in the Southeast Panhandle - he may have pushed Juneau into the Reagan camp. Clark tended to do best in Republican-friendly areas, but didn't take those areas away from Reagan.
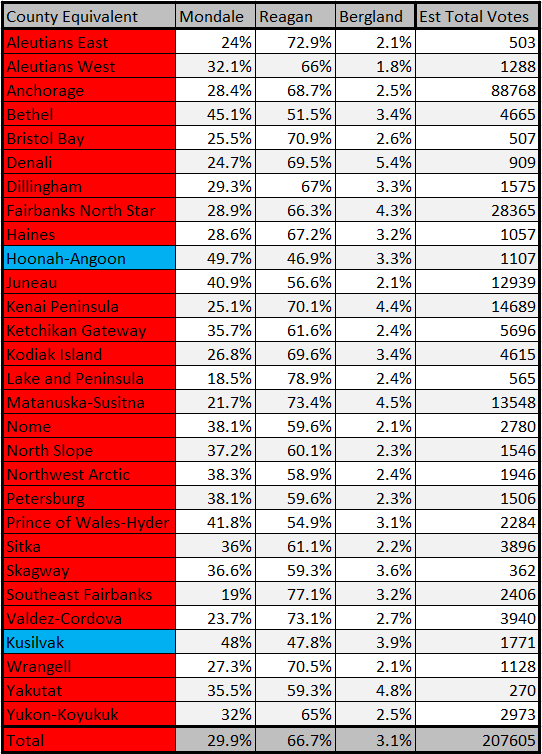
1984 - Reagan Nearly Sweeps Alaska

Ronald Reagan cruised to reelection nationwide in 1984. Alaska was no exception. Reagan's 37-point margin is the largest in Alaska history. But unlike Johnson, Reagan did not sweep every Alaska county equivalent - he barely lost the Hoonah-Angoon and Kusilvak Census Areas. Without the backing of Koch money, Libertarian David Bergland barely registered, only winning 3% of the vote.
The results by county equivalent chart isn't all that surprising. Traditionally Republican-leaning areas tended to vote more Republican than Democratic-leaning areas. Anchorage was only slightly Republican-leaning compared to the rest of the state. The estimated vote totals show that Mat-Su passed Juneau in the number of votes cast in 1984.
1988 - George H.W. Bush Follows Reagan's Path to Victory
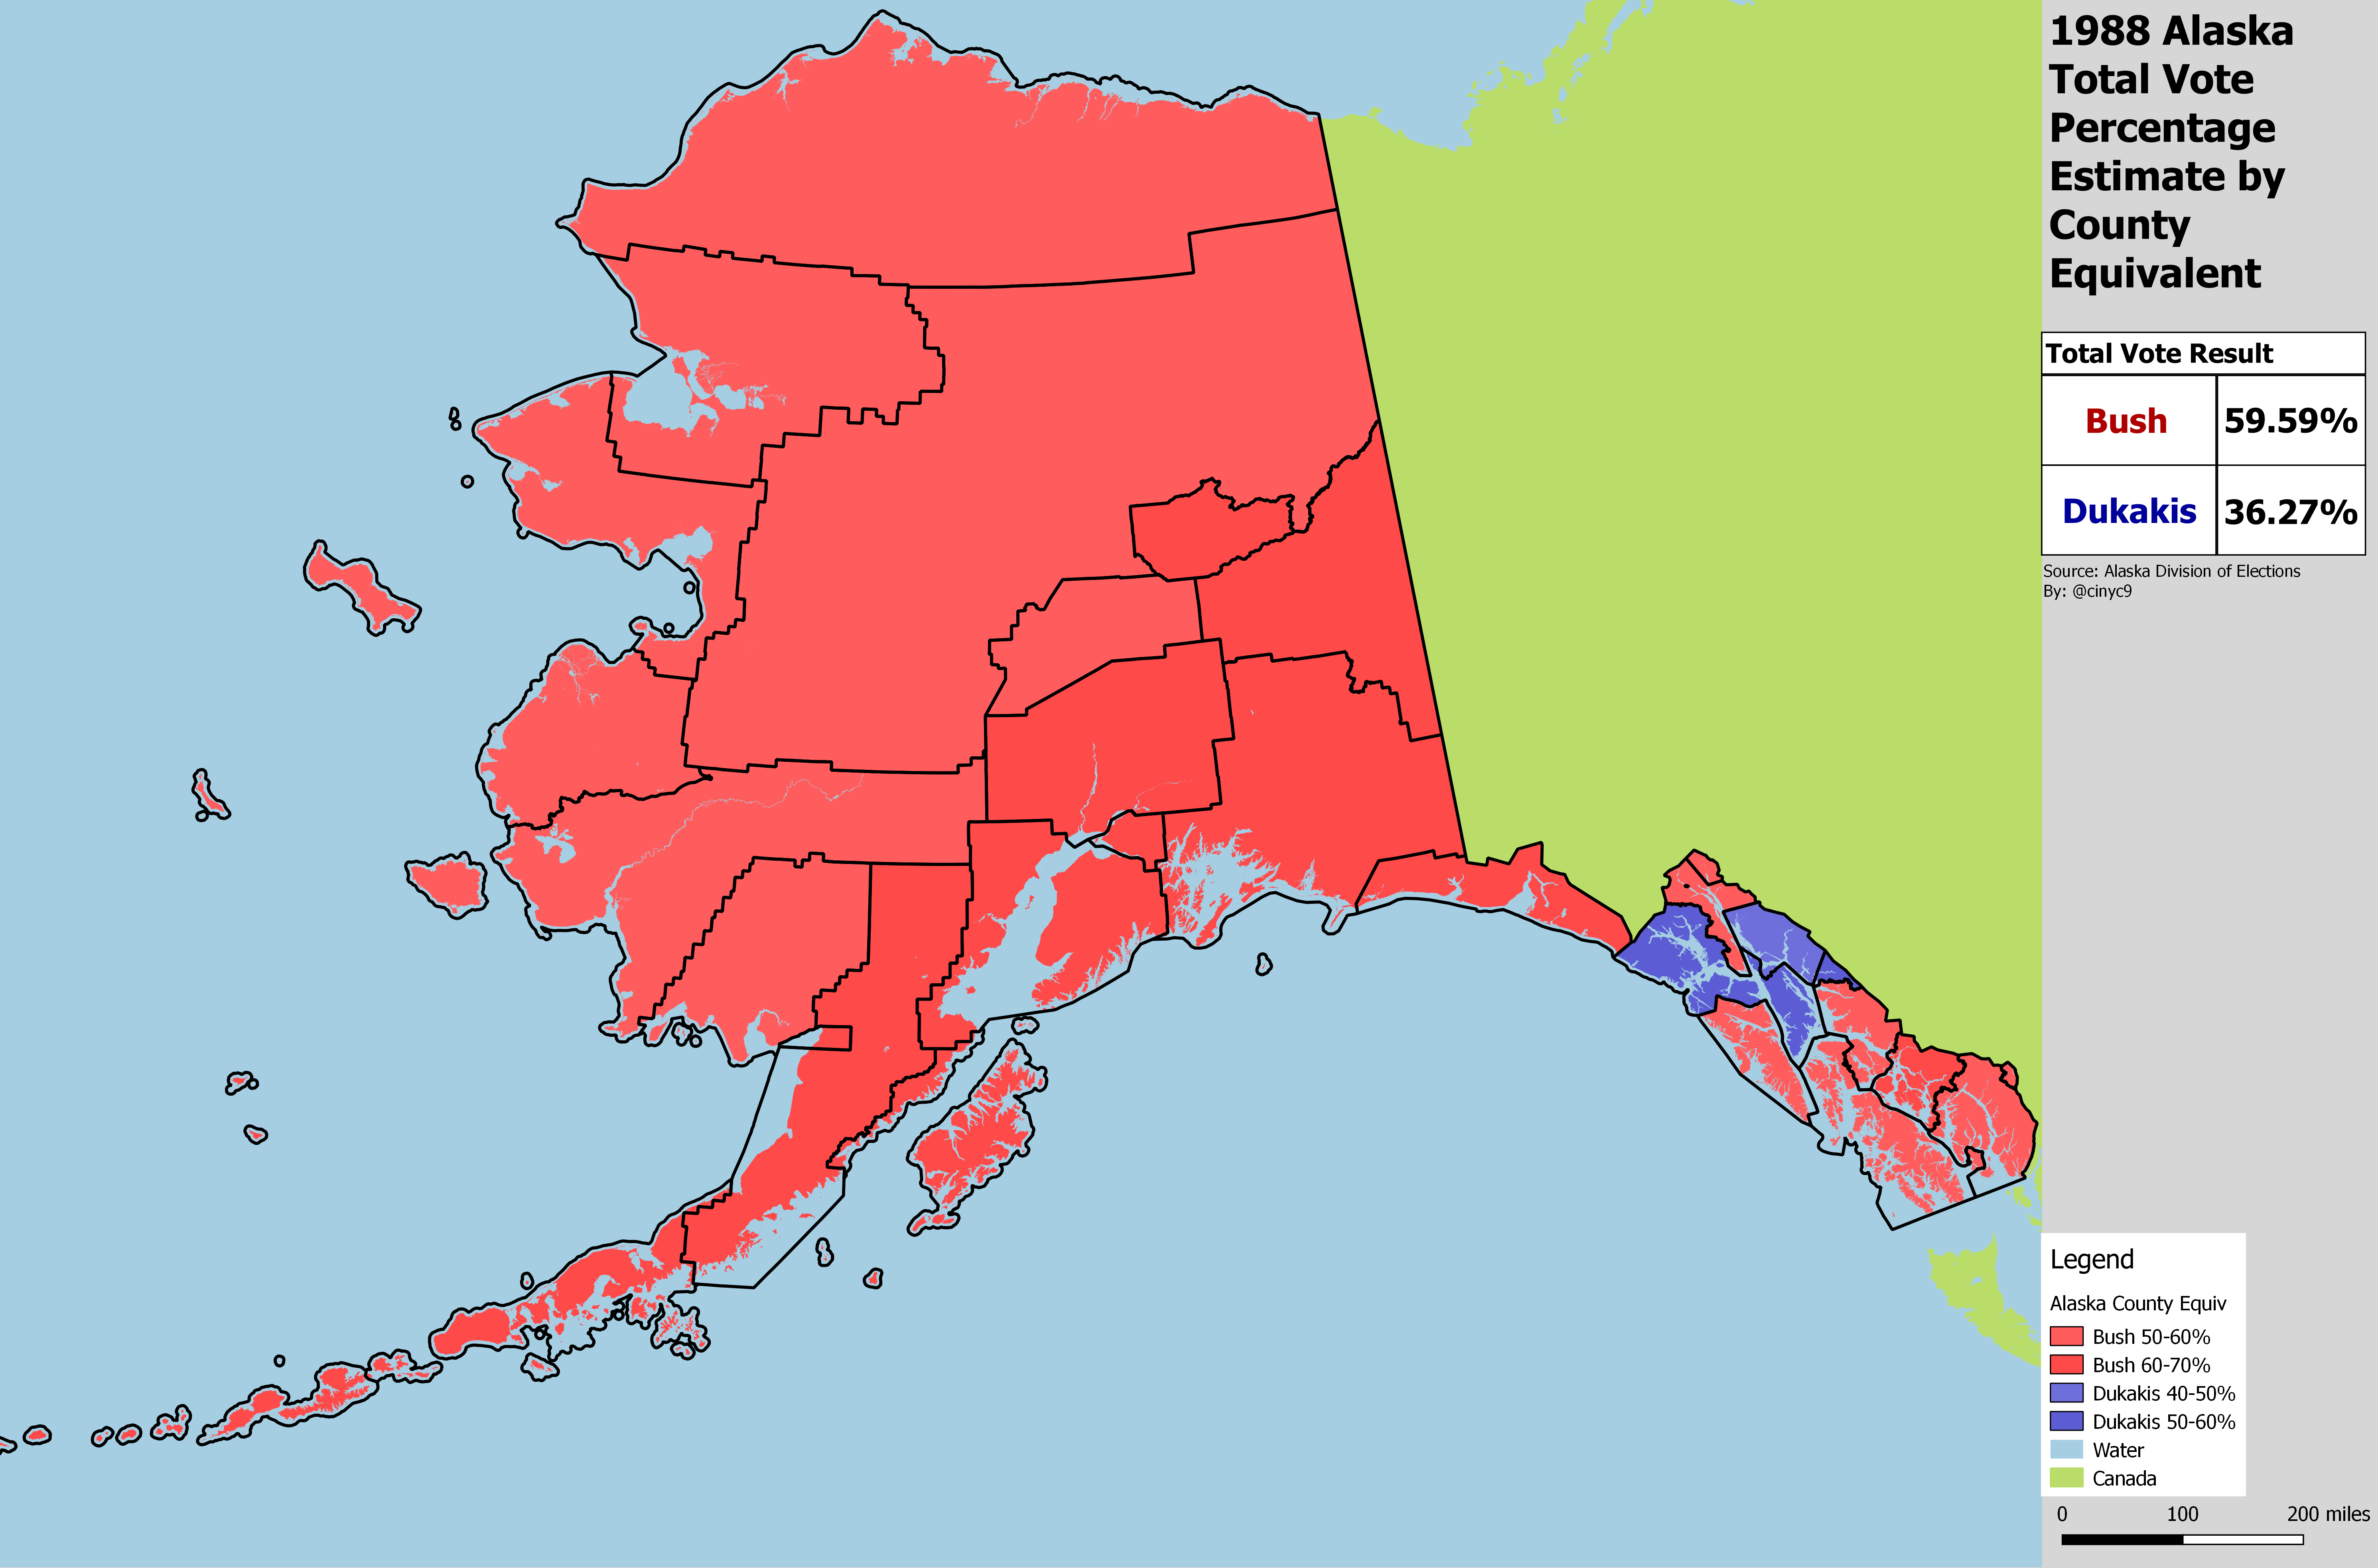
Ronald Reagan's Vice President, George H.W. Bush, handily won Alaska in 1988 by 33 points. The map reflects this landslide, with Bush only losing the capital of Juneau and Hoonah-Angoon. Ron Paul was the Libertarian candidate, and barely registered, winning less than 3% of the vote.
Anchorage again voted slightly more Republican than the rest of the state.
1988 is the first cycle (so far) that I've mapped the in-person election day vote by precinct. Here's the precinct map. I can't stress enough that this is of the in-person election day vote only, and does not include absentee or question (i.e. provisional) votes, which Alaska only breaks down by House District:
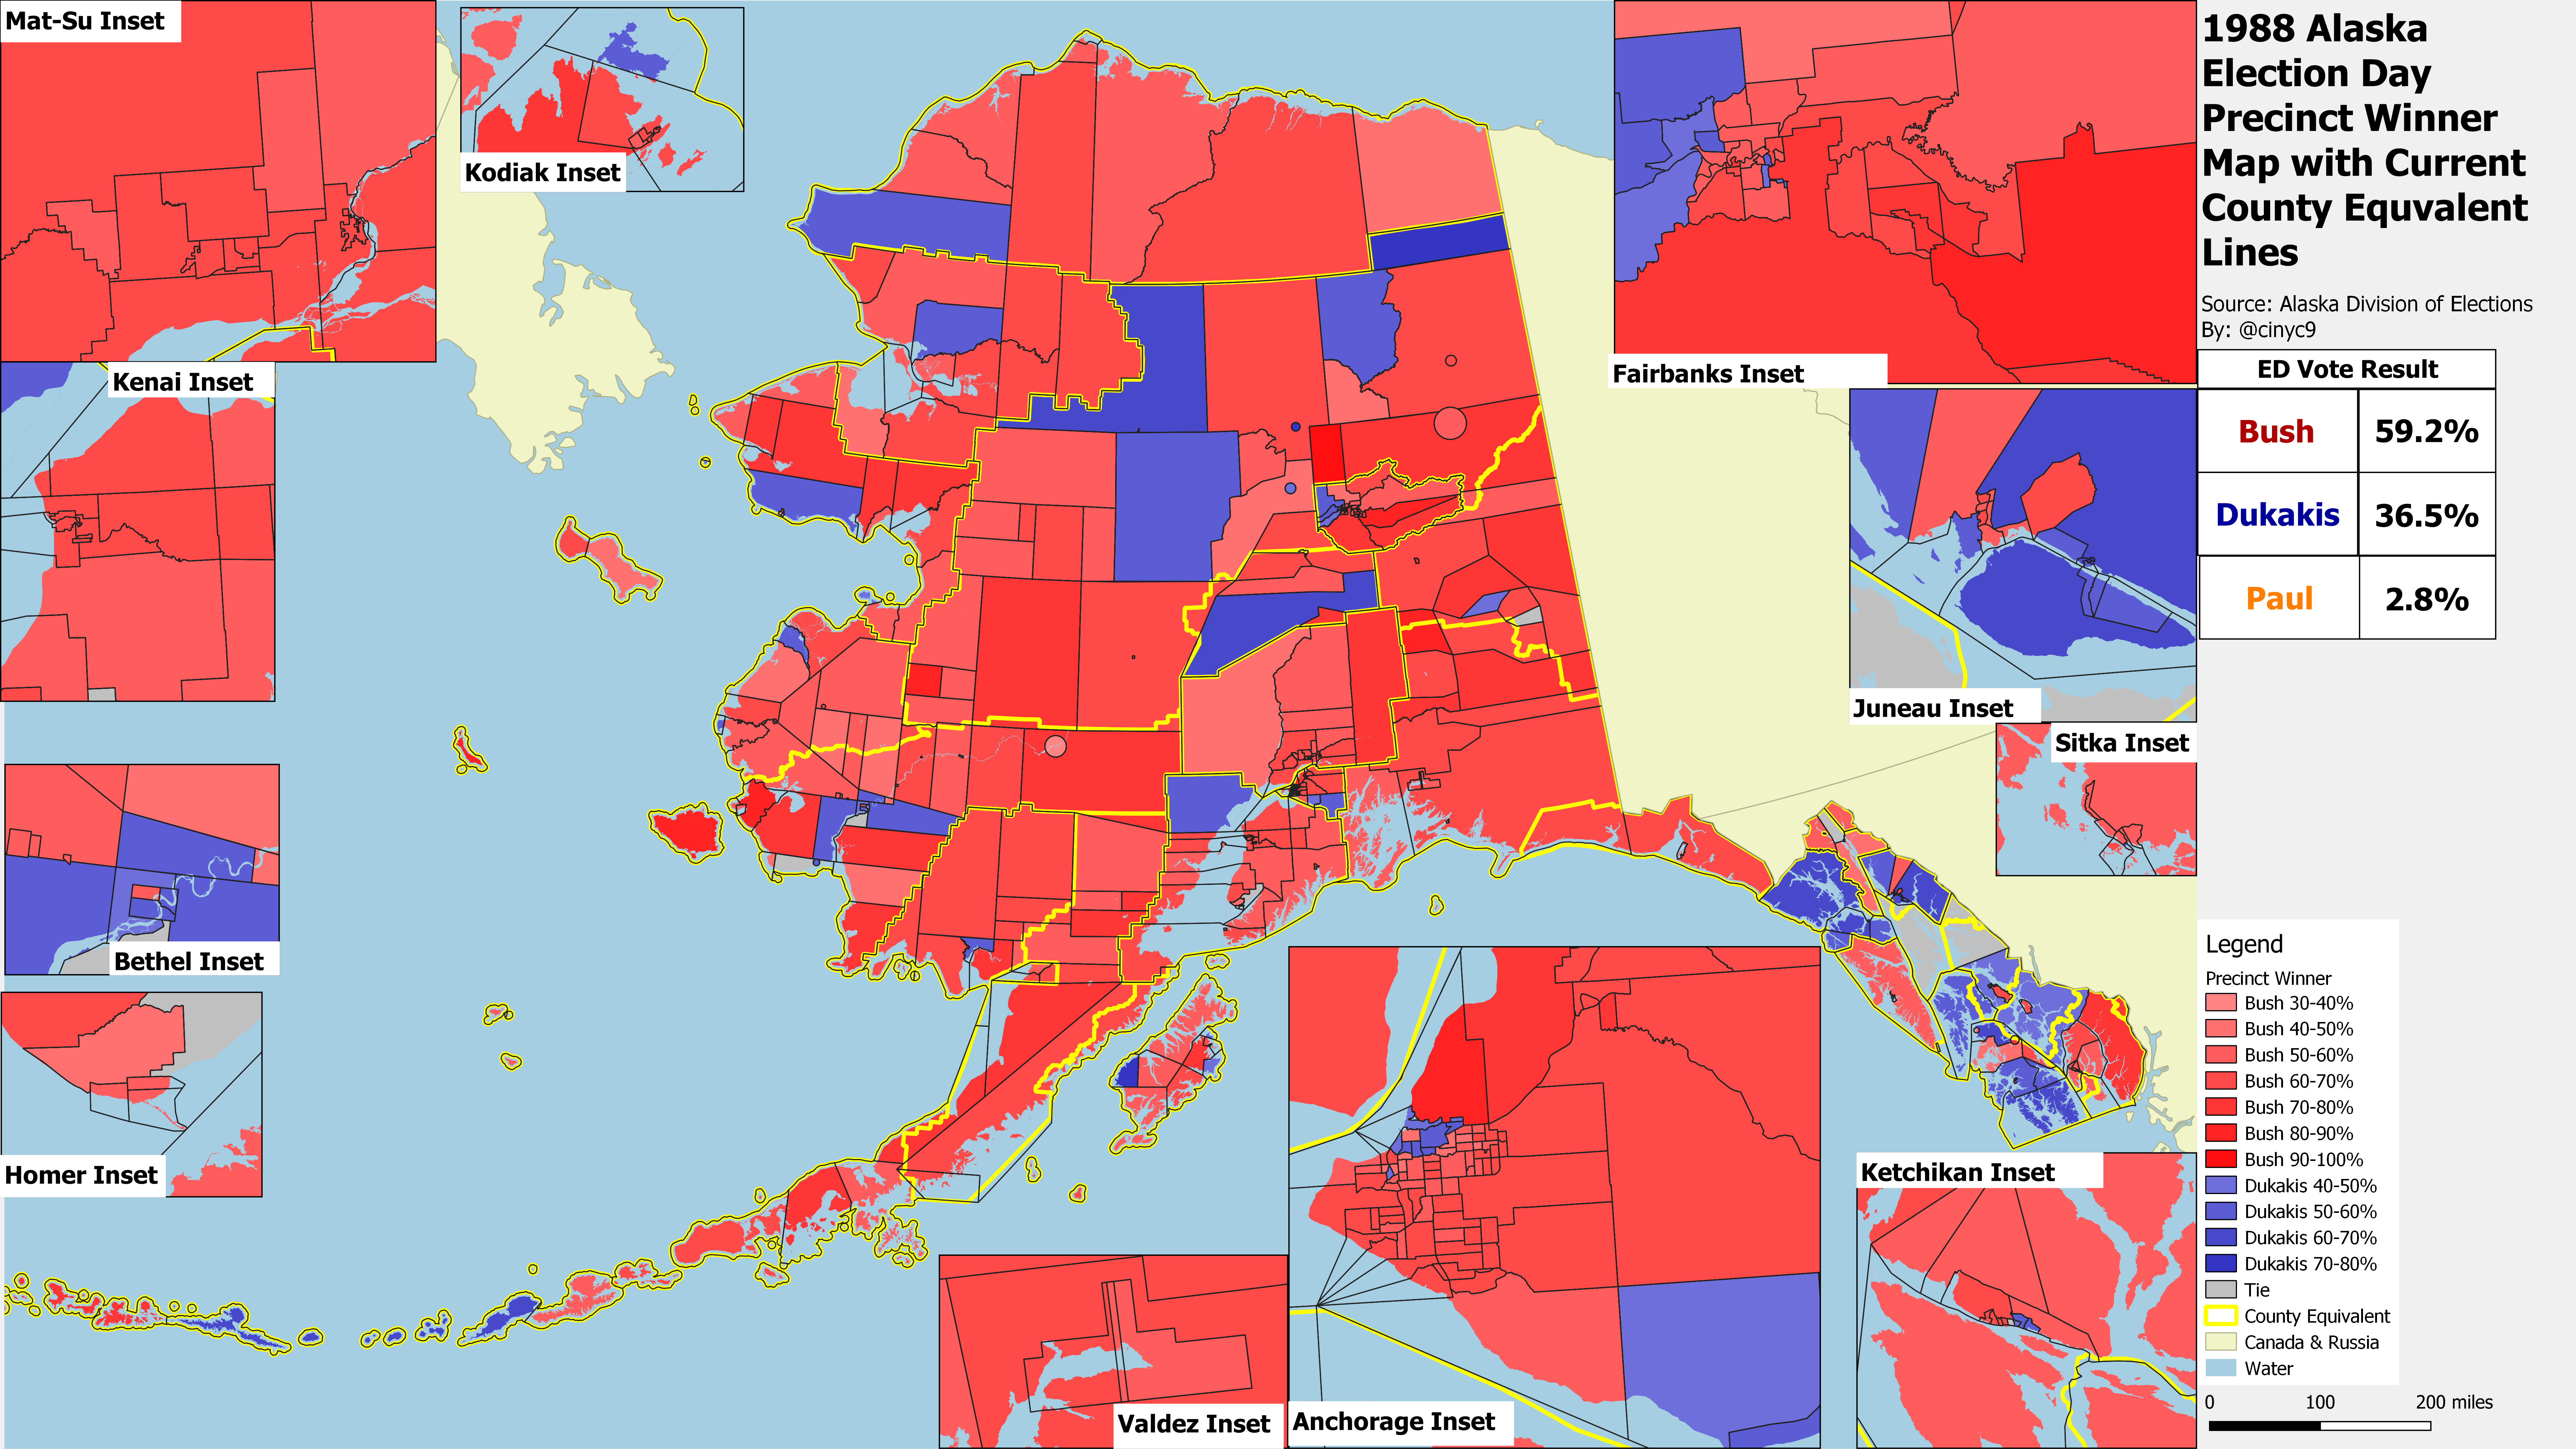
Perhaps unsurprisingly, the precinct map shows that Bush won the overwhelming majority of precincts, including Anchorage outside of Downtown and Girdwood/Indian and Juneau's suburban Mendenhall Valley. He even won a fair number of rural bush precincts.
As the yellow and black lines on this map shows, 1988 precincts do not necessarily conform to 2018 Alaska County Equivalent lines. Thus, allocating the election day vote to counties is an inexact science. All of my esitmates are just that - estimates. Nevetheless, here's the 1988 county equivalent results weighted estimate chart:

1992 - Bush Wins Again; H. Ross Perot has a Very Strong Showing, Winning Denali Borough

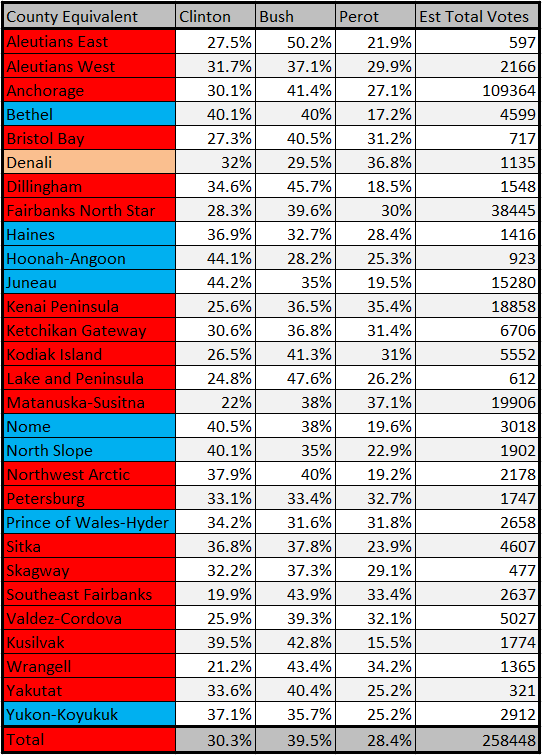
The 1992 Presidential election in Alaska was truly a three-way contest, with Bush narrowly winning the state by 9 points over Clinton. Billionaire H. Ross Perot came within 2 points of winning second place. He even won a county equivalent - Denali Borough, home to the national park and mountain with that name.
As the precinct map below showsl, Bush won 271 election day precincts to Clinton's 149 and Perot's 42. 7 precincts were tied. Perot's winning precincts were scattered throughout the state in Republican-leaning areas, including 9 in Kenai Peninsula Borough, and 7 in Mat-Su - the Republican heartland of Alaska. Because of Perot's good showing in those boroughs, Anchorage actually voted more for Bush than those two boroughs in 1992. Perot also won 5 precincts each in Fairbanks-North Star Borough, the interior Yukon-Koyukuk Census area and Southeast's Prince of Wales-Hyder, 4 of Denali's 5 precincts, 2 precincts on Kodiak Island, and 1 precinct each in Anchorage, Bristol Bay, Ketchikan, Petersburg and Valdez-Cordova, and won the questioned vote in a majority of House Districts.

Mat-Su passed Kenai in the number of votes cast, as it truly began to boom:
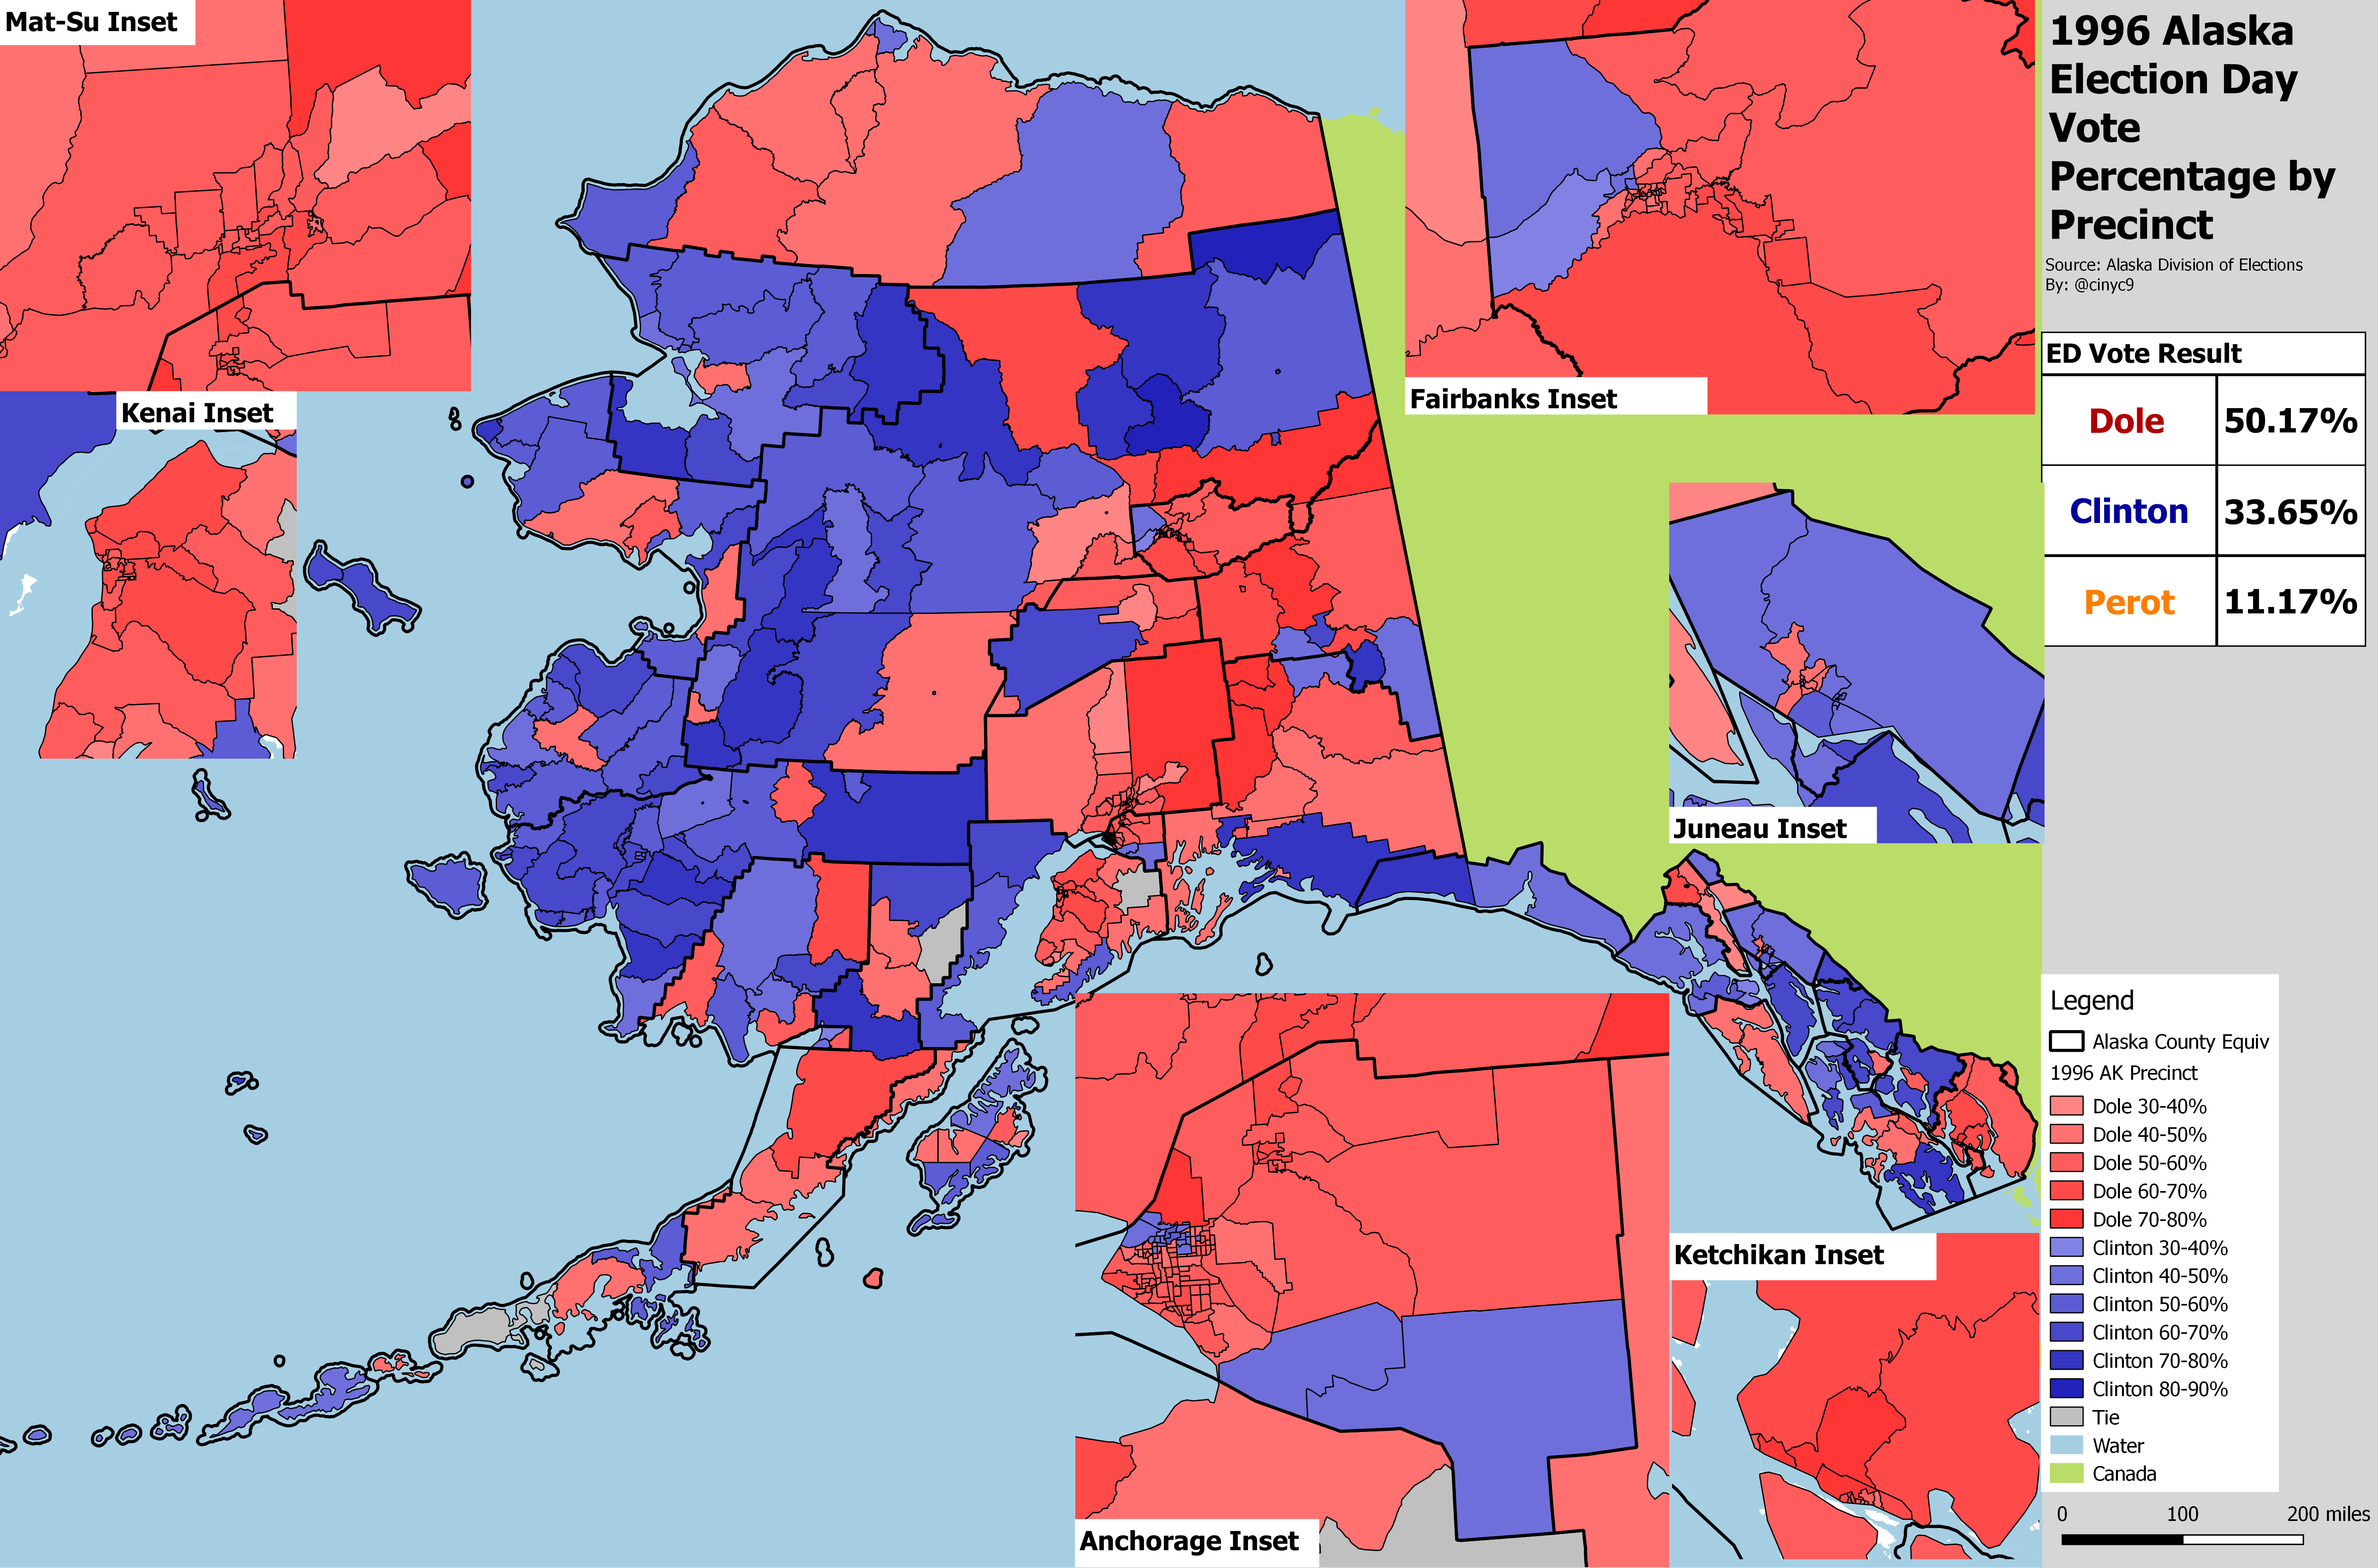
1996 - Bob Dole Takes Alaska as Perot Fades
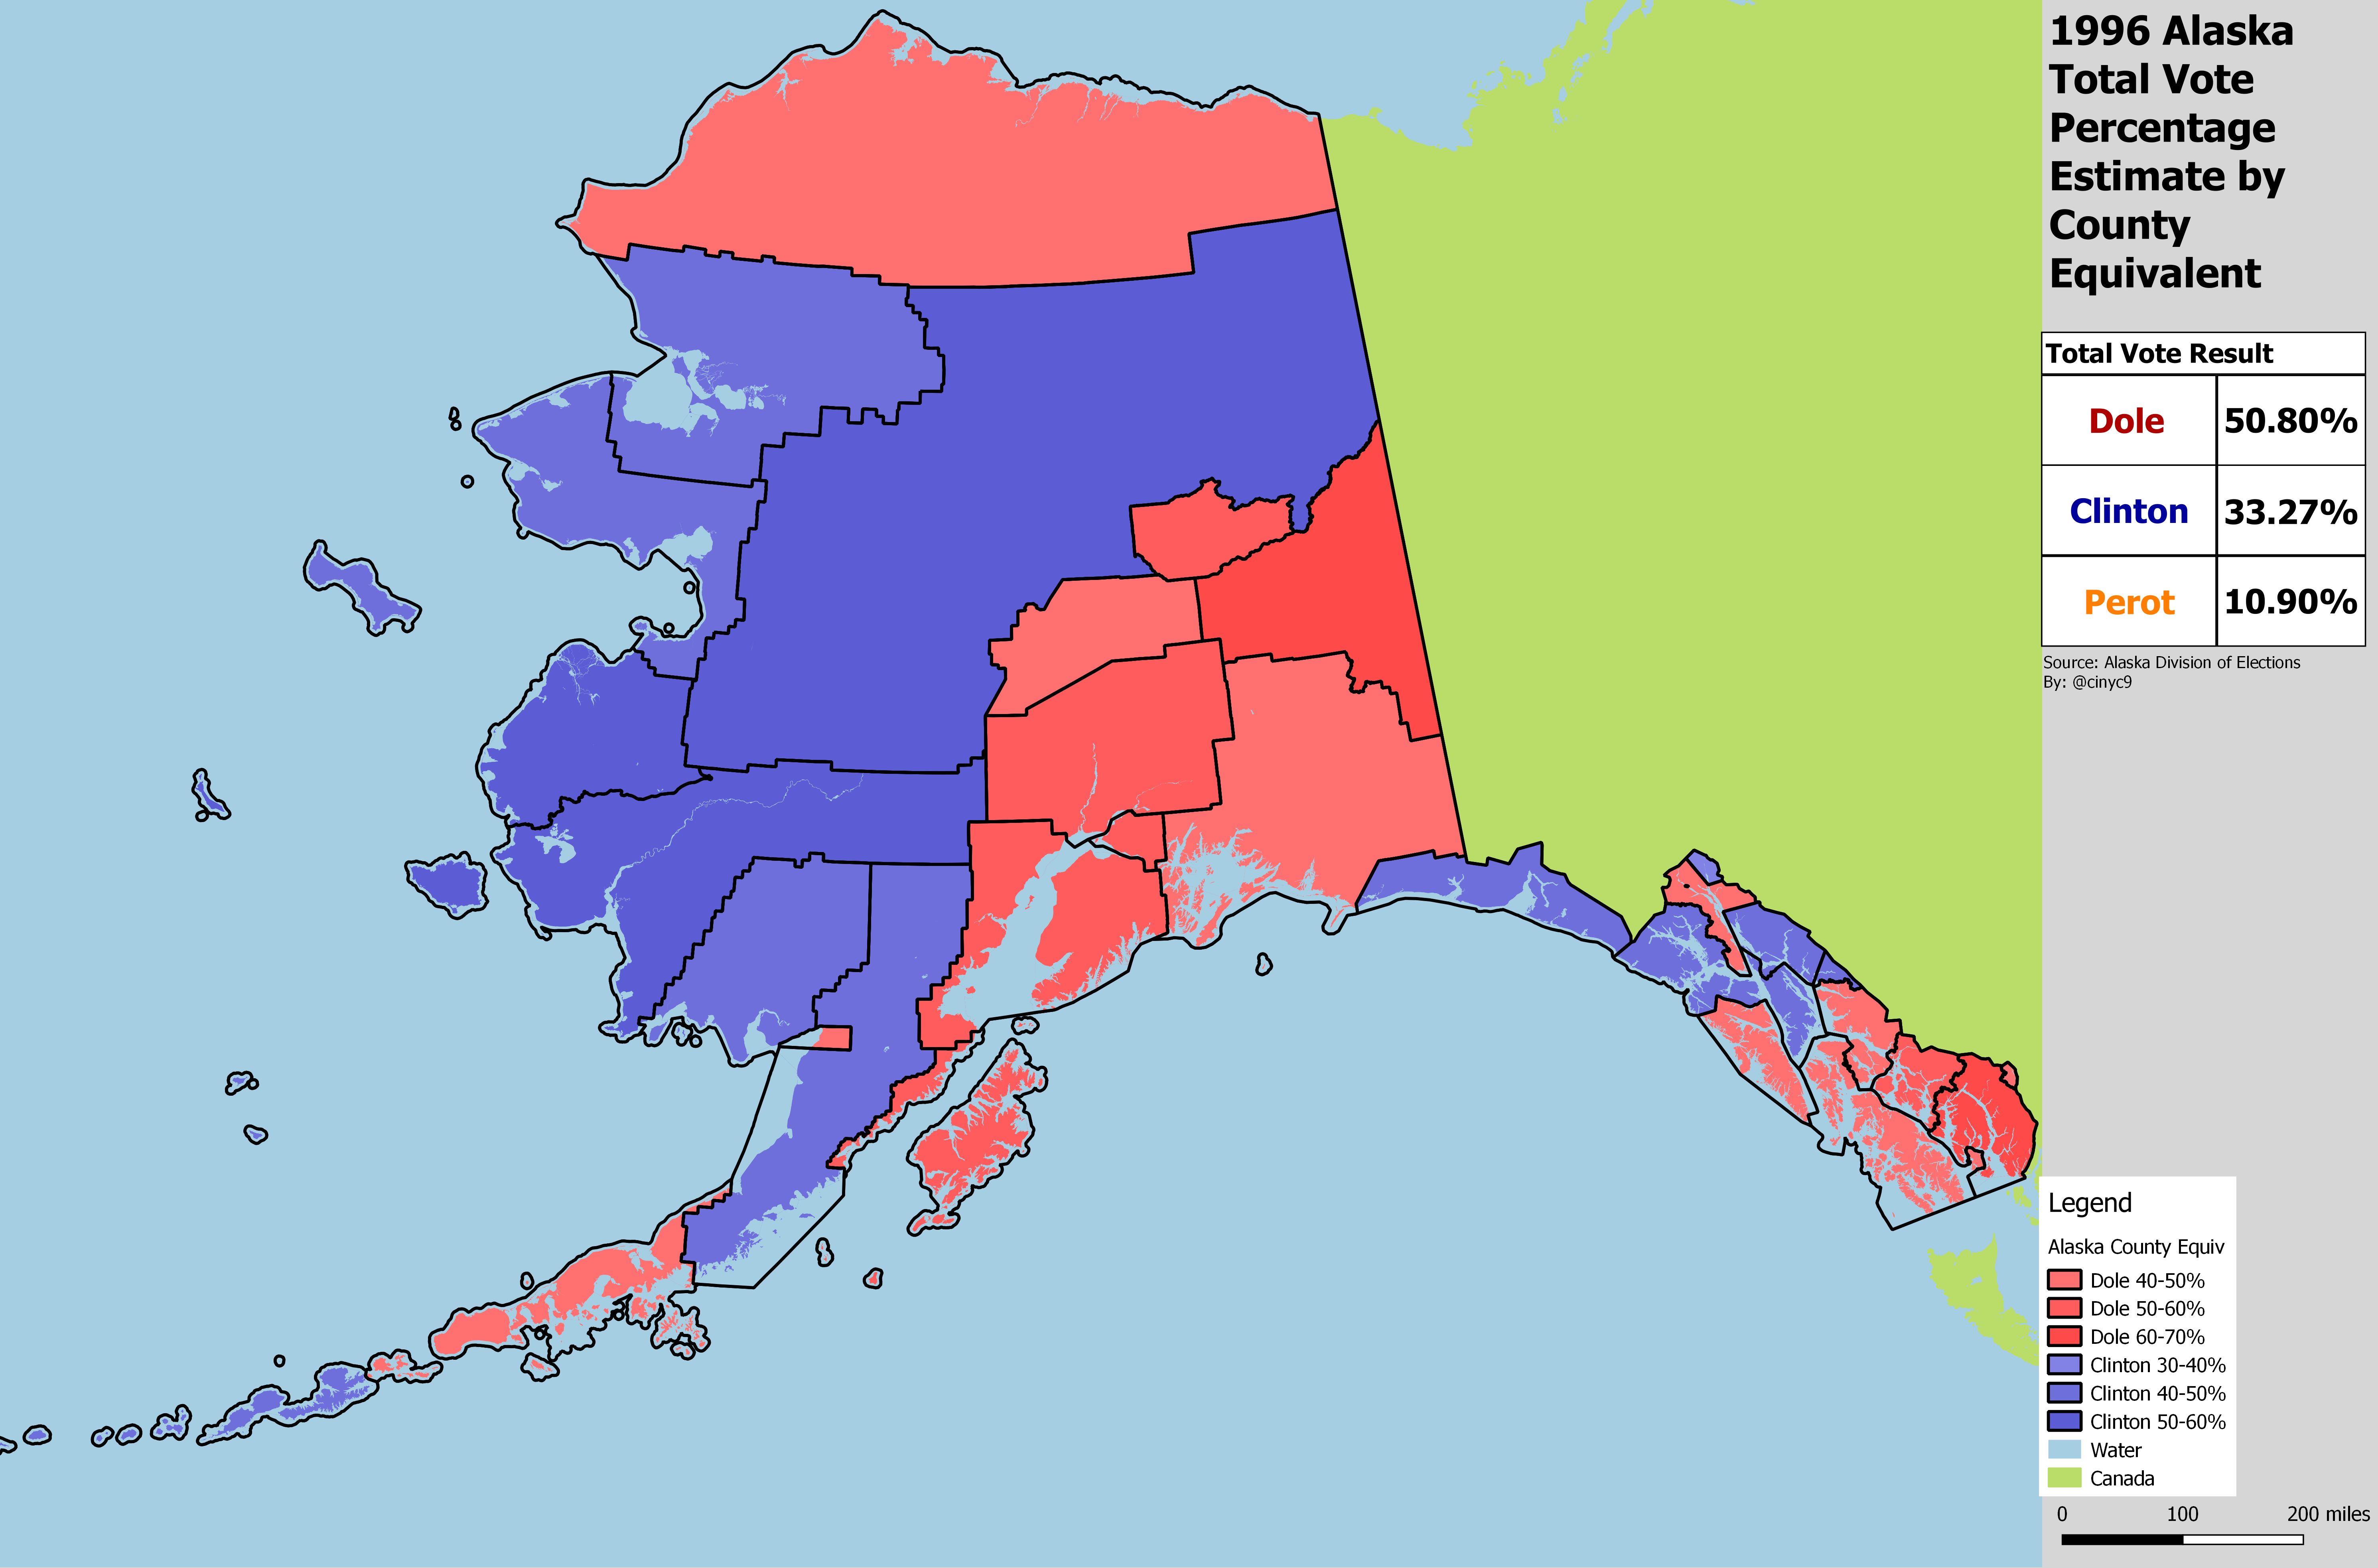
The 1996 election was nominally a 3-way contest, with H. Ross Perot running for President again. This time, he didn't fare as well in Alaska or nationwide, only getting about 11% of the Alaska vote. That allowed Republican Bob Dole to win the state with a bare majority of the vote, unlike George H.W. Bush four years prior.
As the precinct map below shows, unlike 1992, Perot did not win any precincts in 1996. Dole won every precinct in Mat-Su, and most in Fairbanks and Anchorage:
As the county equivalent chart shows, Anchorage voted about in line with the rest of the state in 1996. The traditionally Republican-leaning Mat-Su and Kenai Boroughs were a little less so, due to a relatively good showing by Perot.

2000 - Like Father, Like Son - George W. Bush Wins Big; Gore Hurt by Nader

The 2000 election may have been close nationwide and in Florida, but it was no contest in Alaska. George W. Bush nearly swept the state, as Ralph Nader took votes from Gore's left. As a result, George Bush finally won Hoonah-Angoon for the Republicans, meaning that the Republicans, too have won every Alaskan county equivalent at least once, according to my estimates.
The county equivalent chart shows Anchorage was slightly Democratic-leaning compared to the rest of the state in 2000. It also shows just how explosive Mat-Su's growth had been since 1980 - that borough now cast over 1.5x more votes than Juneau.
The 2000 precinct map shows that Nader actually won 3 precincts - quirky Talkeetna in Mat-Su and the ski area of Girdwood in Anchorage, which, at least currently, is D-leaning turf, and Haines' Peninsula/Chilkat precinct. Pat Buchanan won Kobuk in Northwest Arctic Borough - unless that is a typo in the official results. Nader's strong showing on traditionally Democratic turf allowed Bush to make inroads into precincts traditionally won by Democrats in places like Downtown Anchorage. Bush didn't even win some of these precincts in his 2004 landslide victory, as we'll see below.
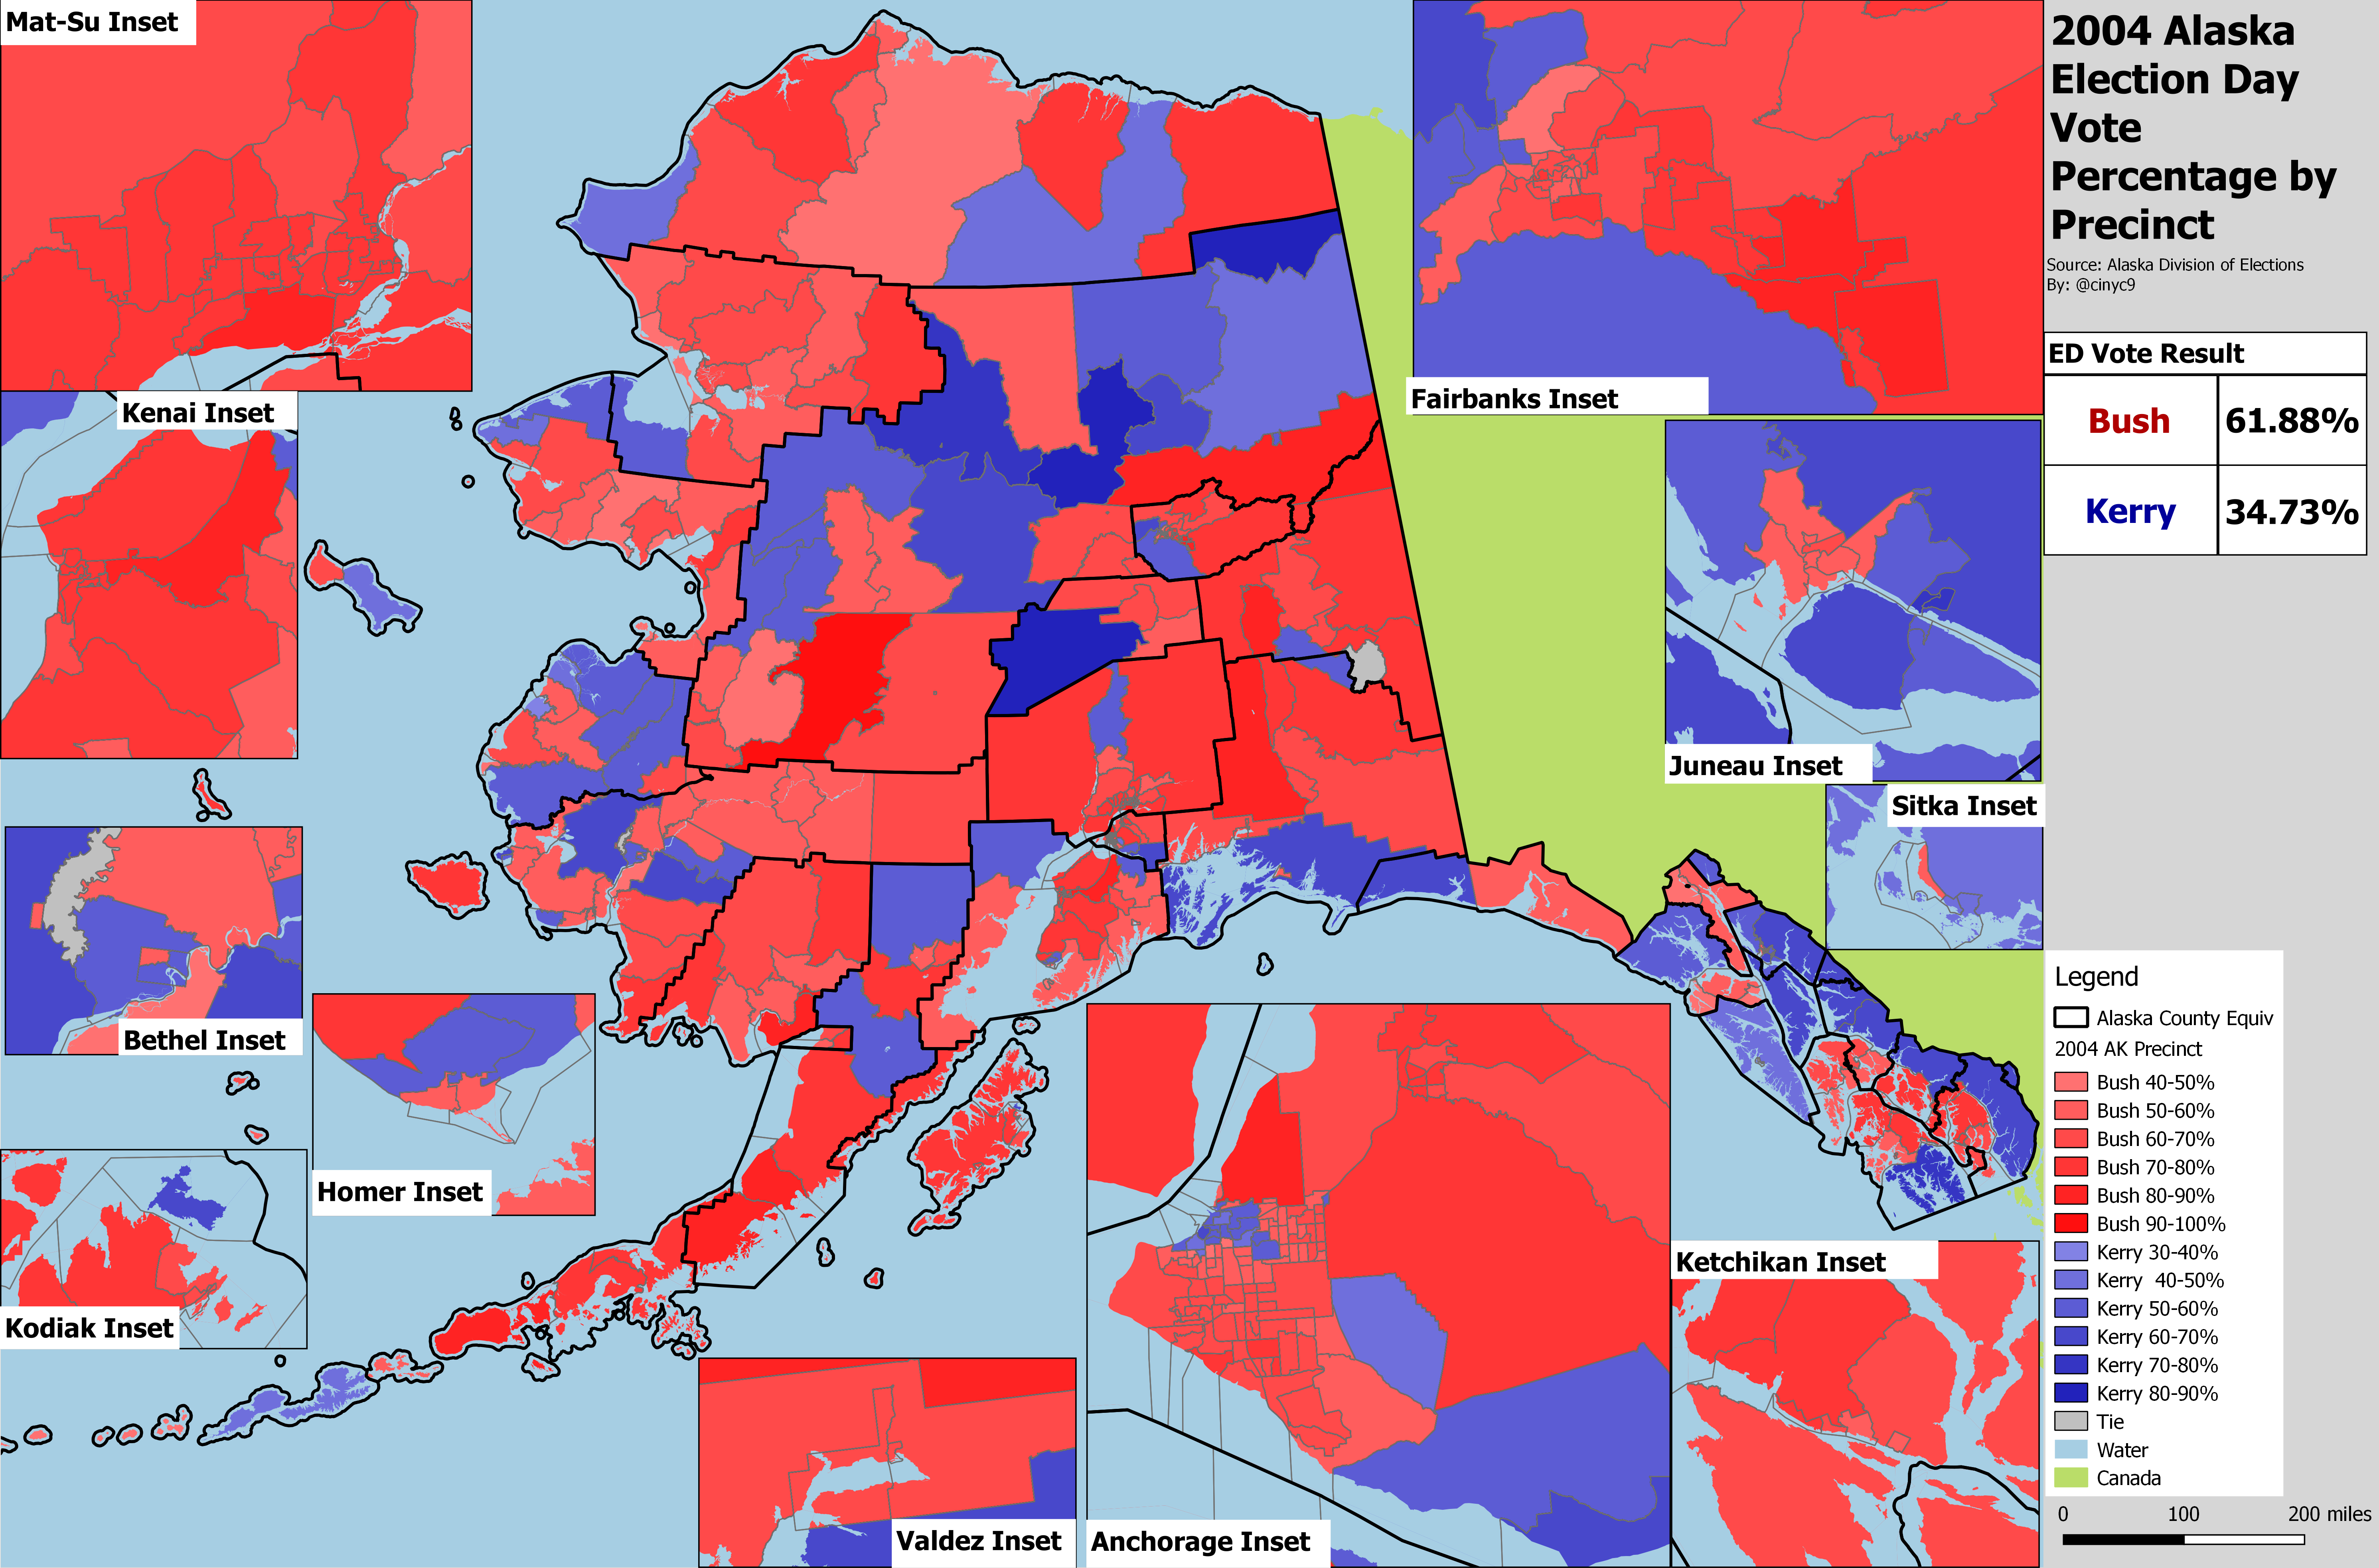
2004 - Bush Kills Kerry
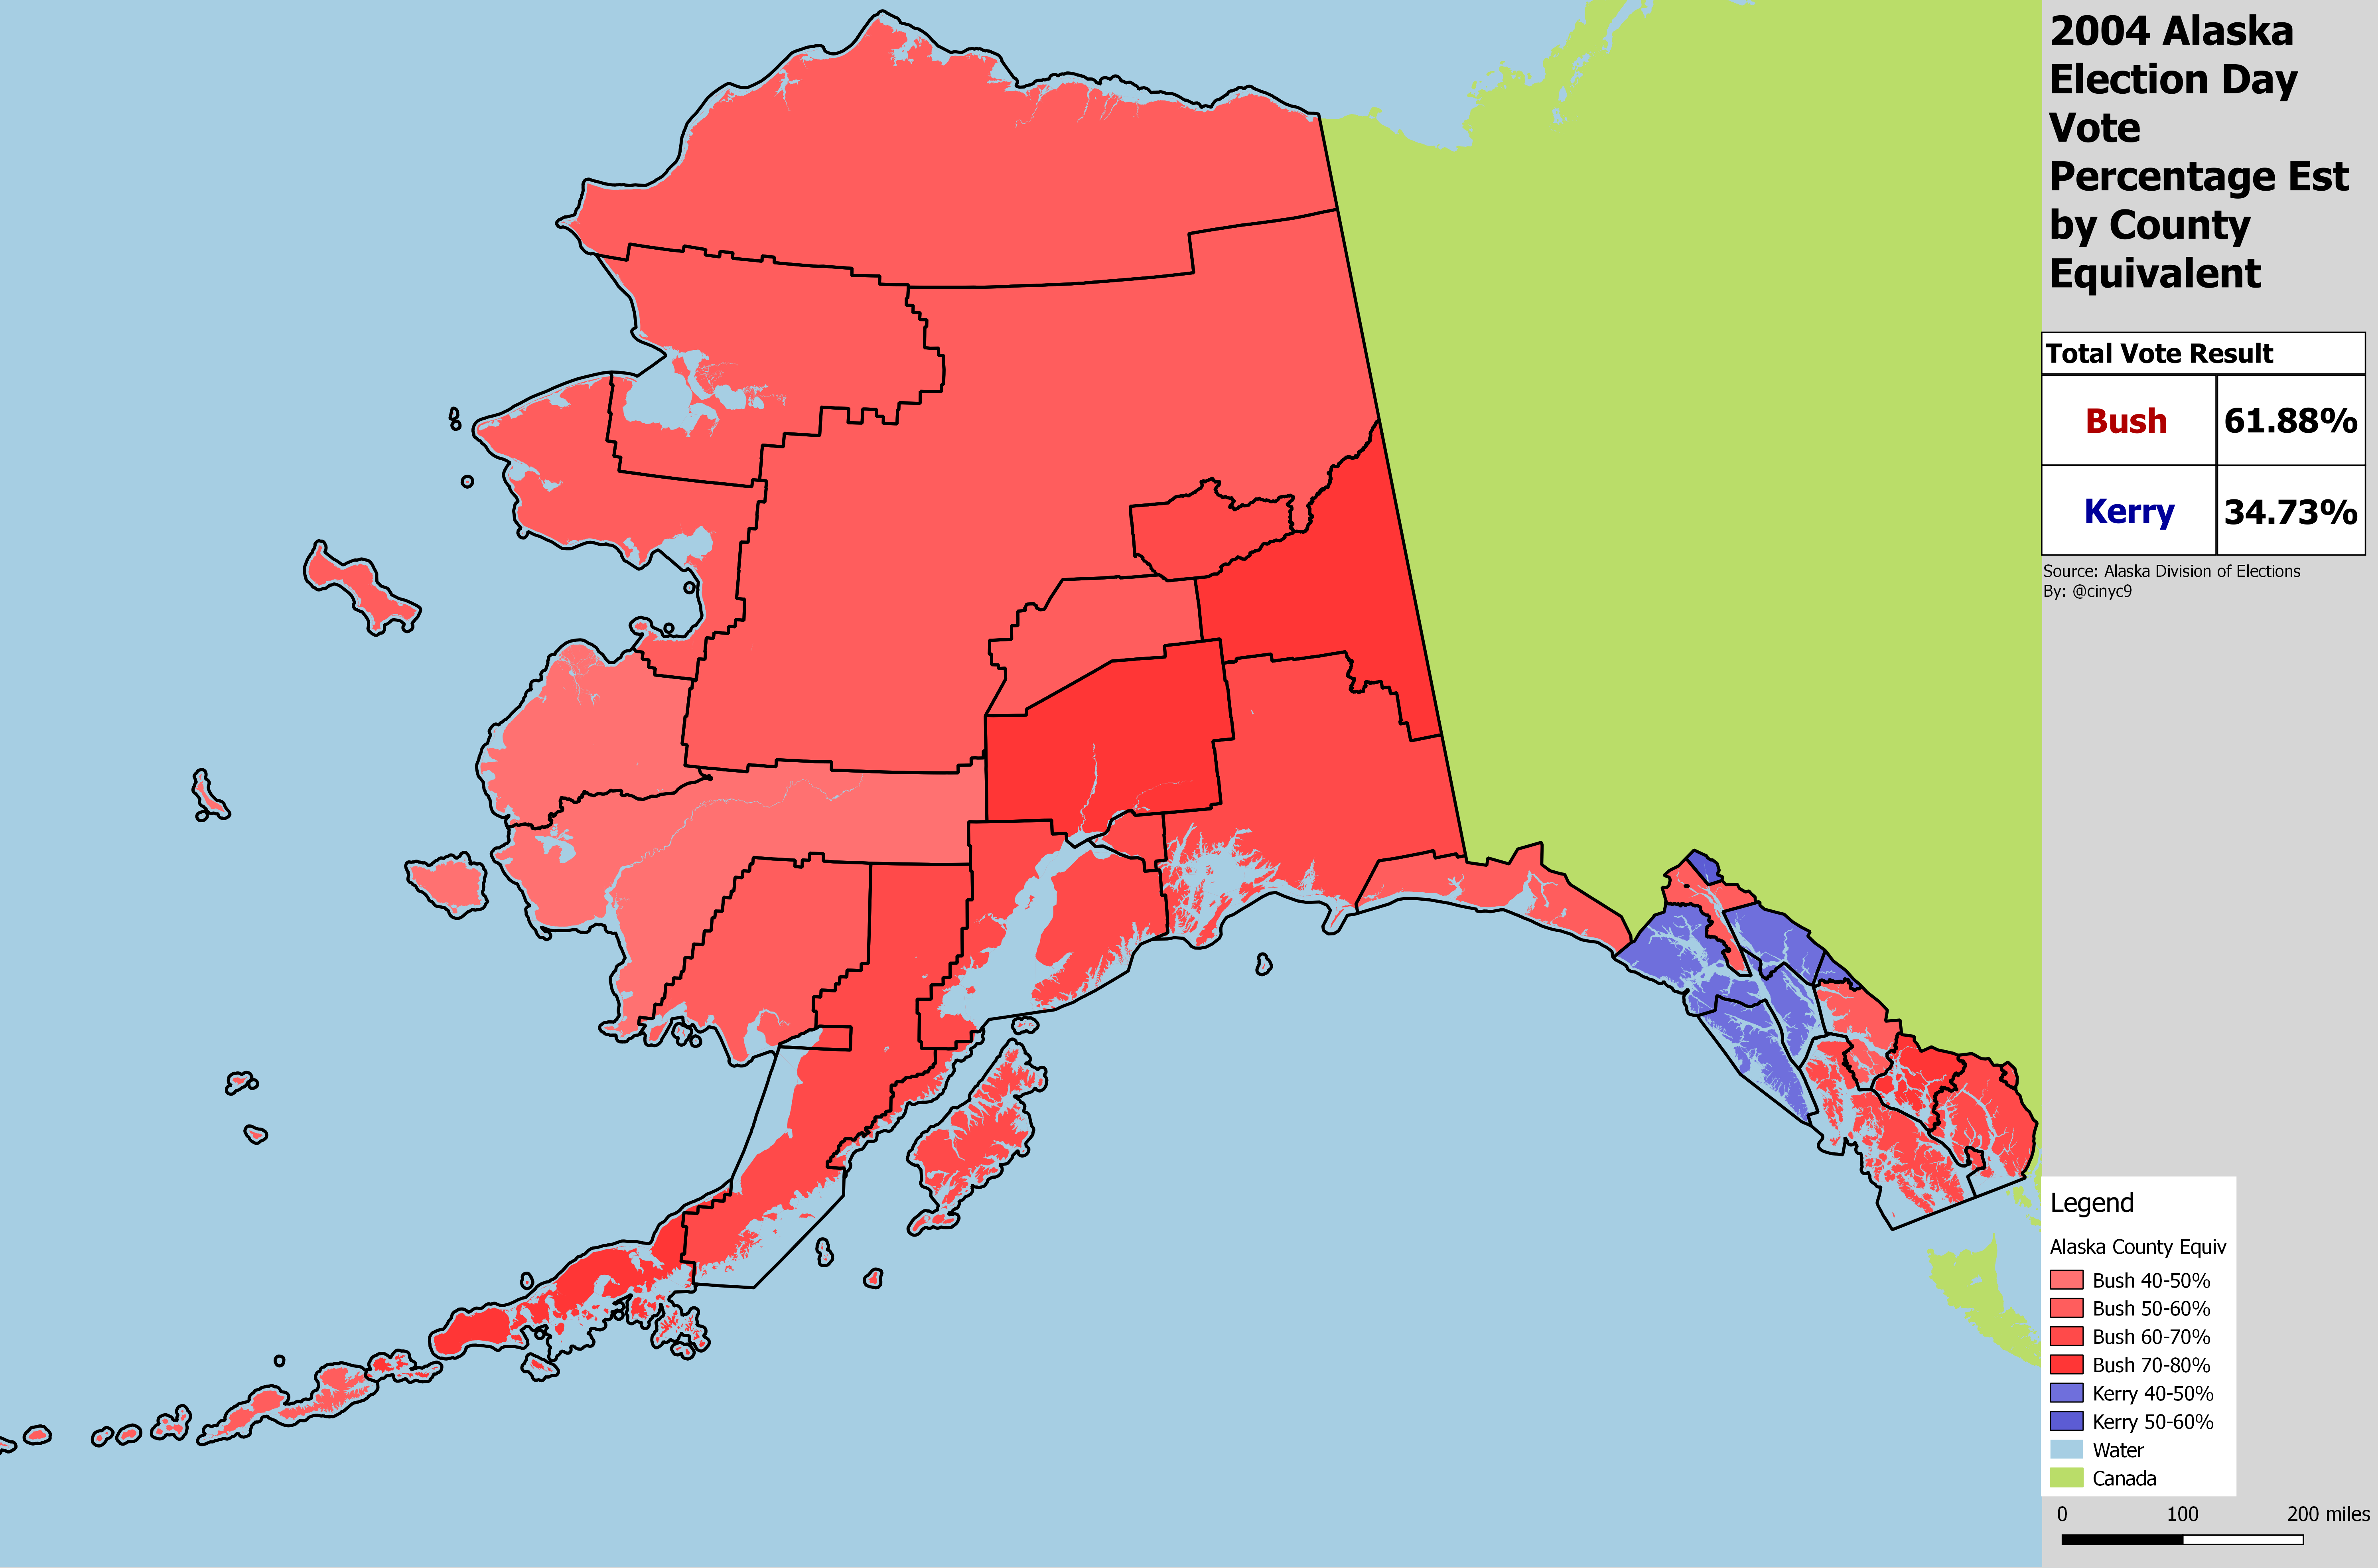
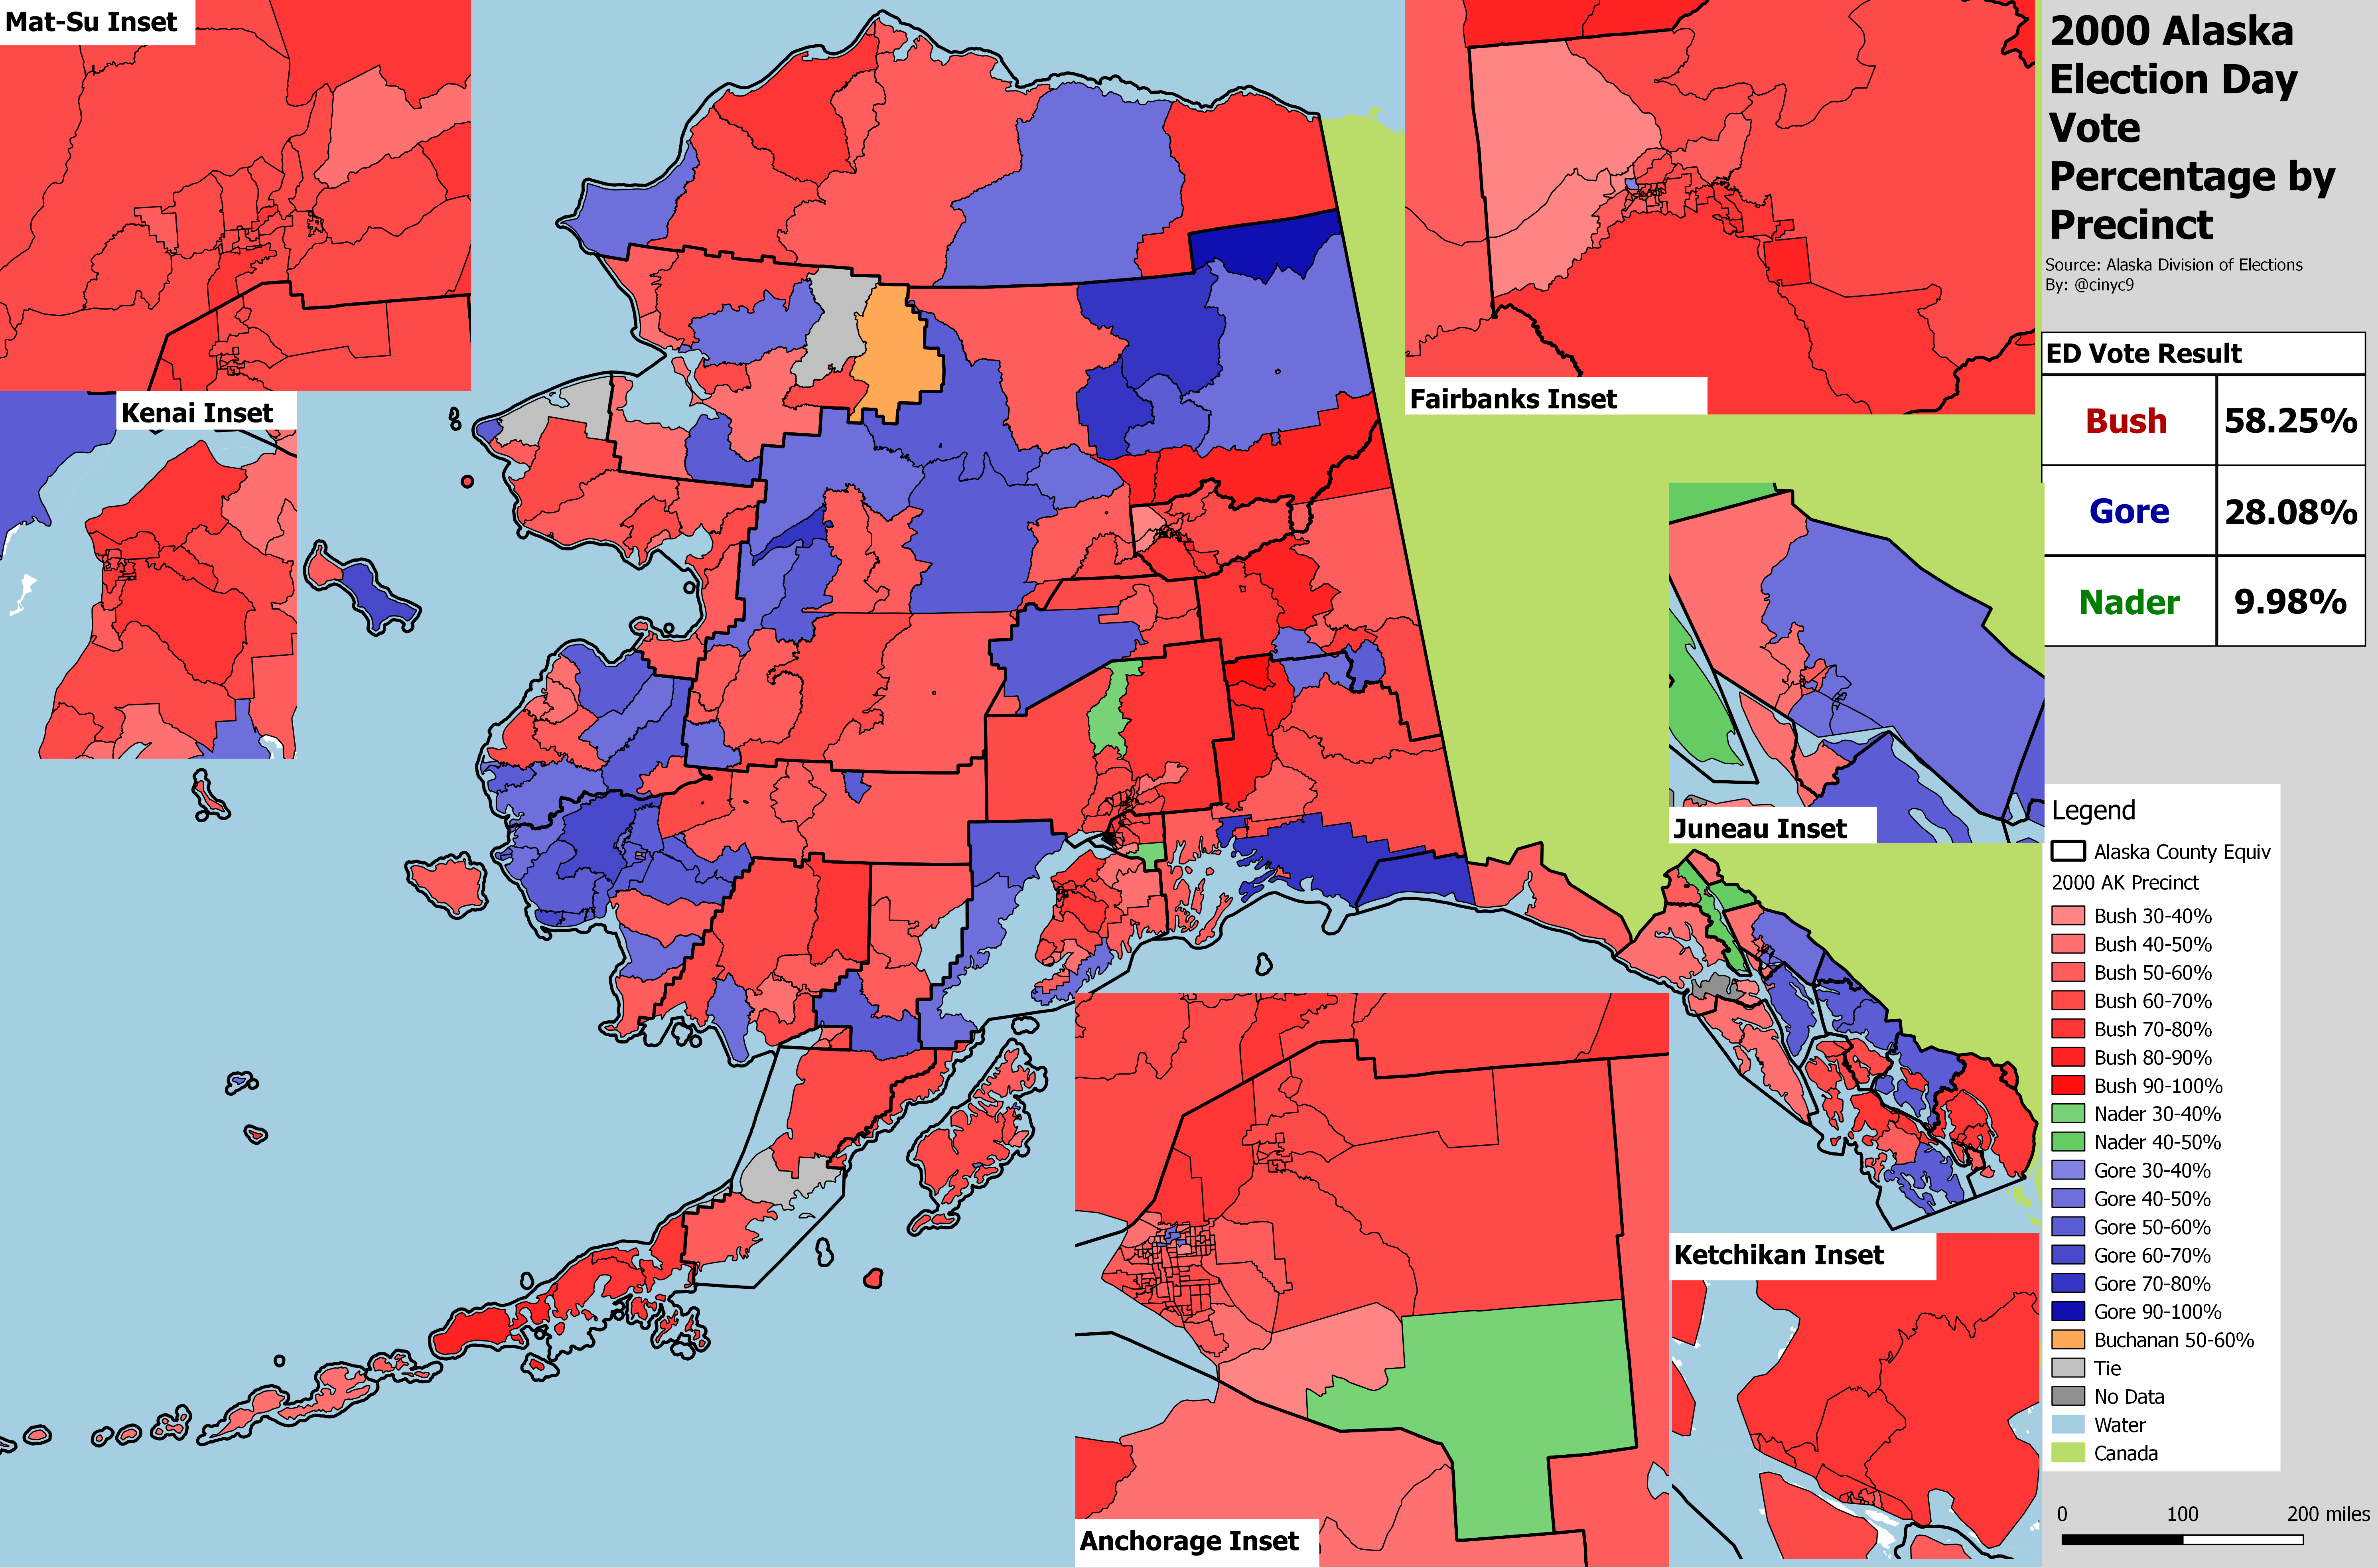
President George W. Bush easily won reelection in 2004 in Alaska. Unlike in 2000, Nader wasn't much of a factor, garnering just 1.6% of the vote. Bush swept the election day vote in all areas outside of Southeast Alaska.
Unfortunately, I cannot yet calculate the total 2004 vote by county equivalent. This is because of the strange way Alaska reported its early vote during the first presidential election with early voting - I'm still working on this, though. Below is a chart of the election day votes by county equivalent only:
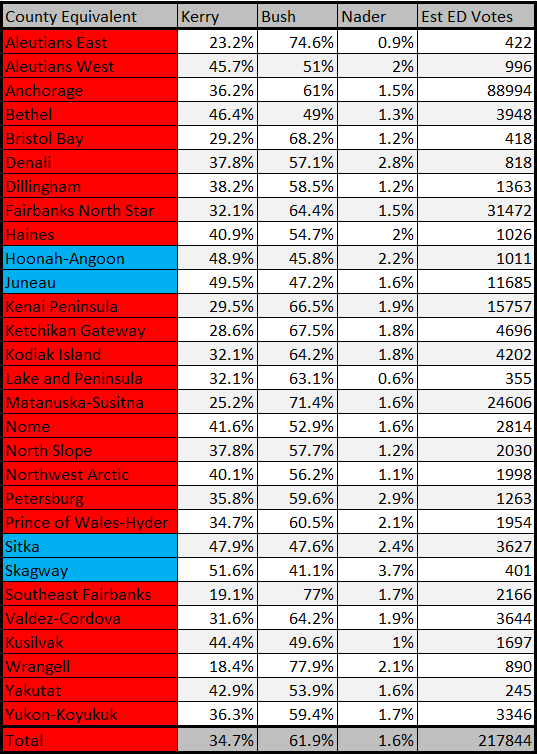
Anchorage voted more or less in line with the rest of the state. Mat-Su, Aleutians East and Southeast Fairbanks were the most Republican-leaning areas. Bush's losses in the Southeast Alaskan election day vote were all by less than 3 points, except in Skagway.
The 2004 precinct map generally shows a sea of red outside of downtown Juneau, western Fairbanks-North Star Borough, Sitka and parts of rural Alaska. In Anchorage, Kerry's wins were held to the areas in and east of downtown Anchorage, plus the far-flung precincts near Girdwood.
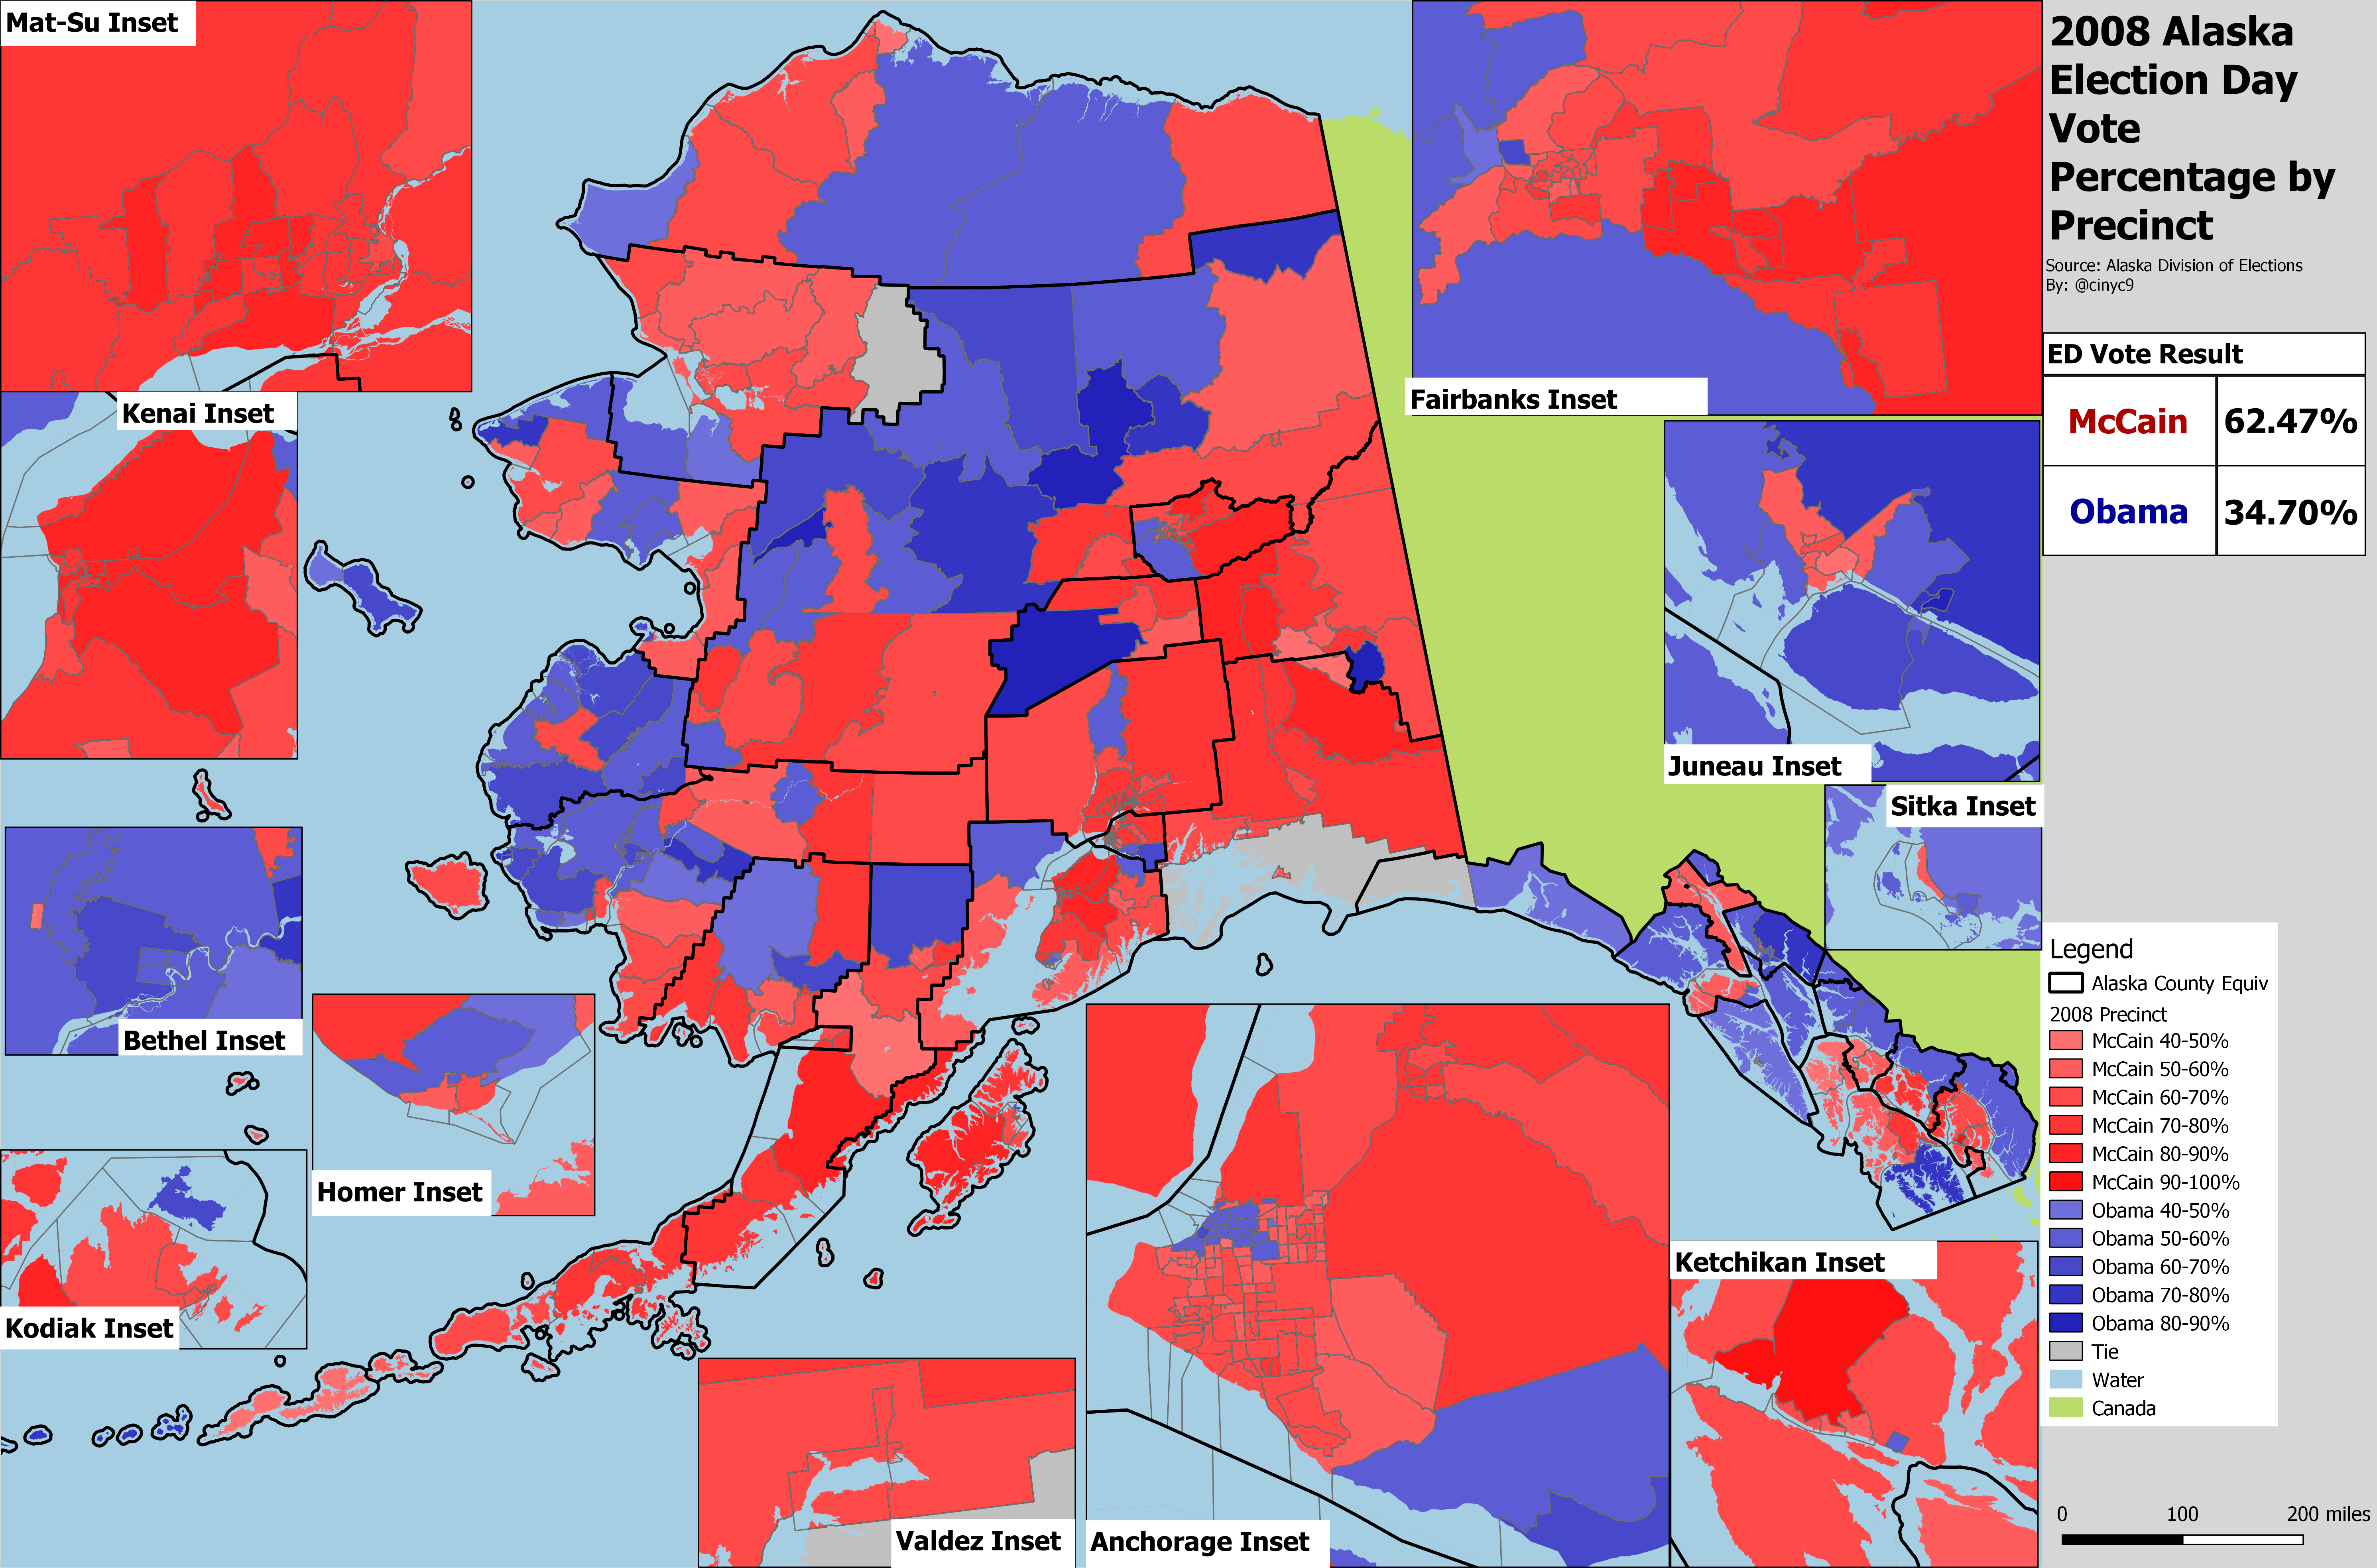
2008 - Alaska Votes for Its Governor for Veep
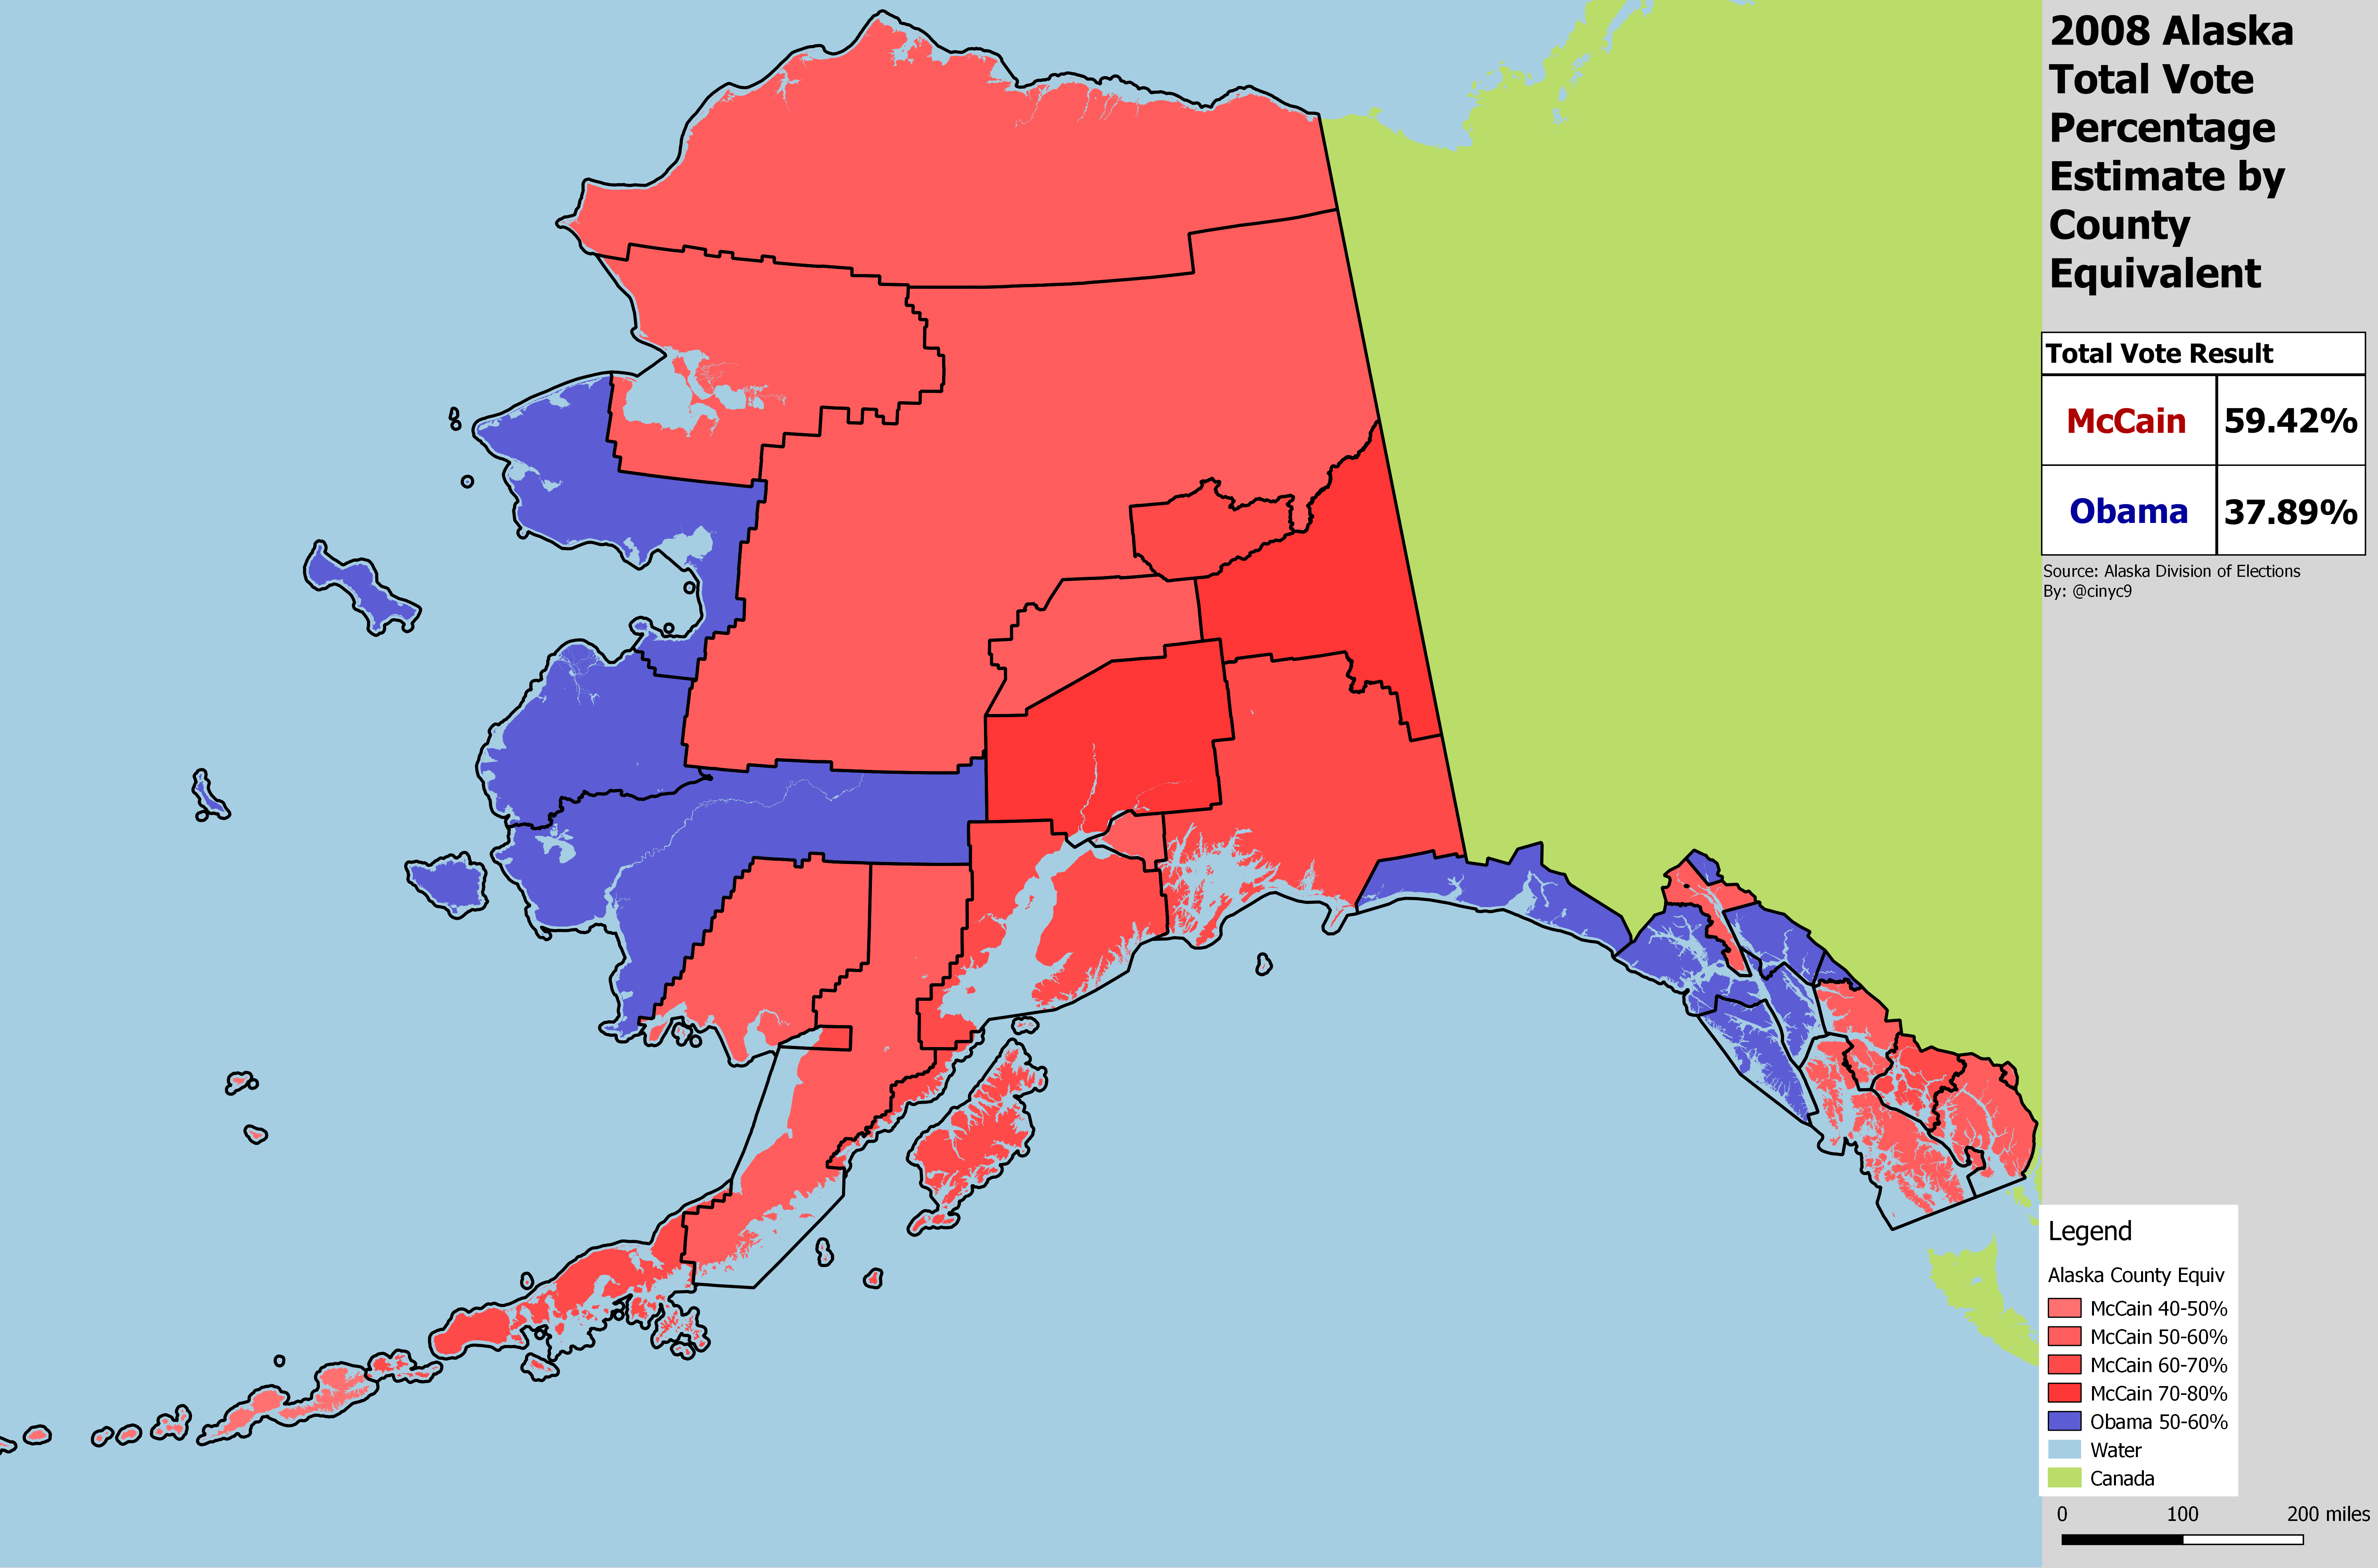
John McCain, with Alaska Governor Sarah Palin on his ticket, beat Barack Obama by about 22 points in 2008. This result was closer than the 2004 election day result - and the map shows it. In addition to losing areas in the Southeast panhandle, McCain lost the total vote in Bethel, Kusilvak and Nome.
Anchorage voted slightly more Democratic than the state as a whole. But Anchorage's leftward shift was offset by Mat-Su, which continued its explosive growth and cast almost as many votes as Fairbanks North Star while remaining staunchly Republican, especially with Wasilla's Palin on the ticket.
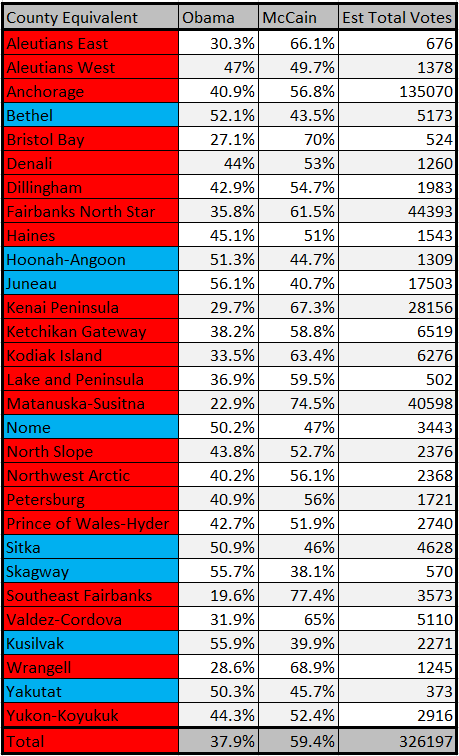
The 2008 election day precinct vote map shows the Anchorage D-R line shifting a little bit further south, and more Democratic turf in rural Alaska.
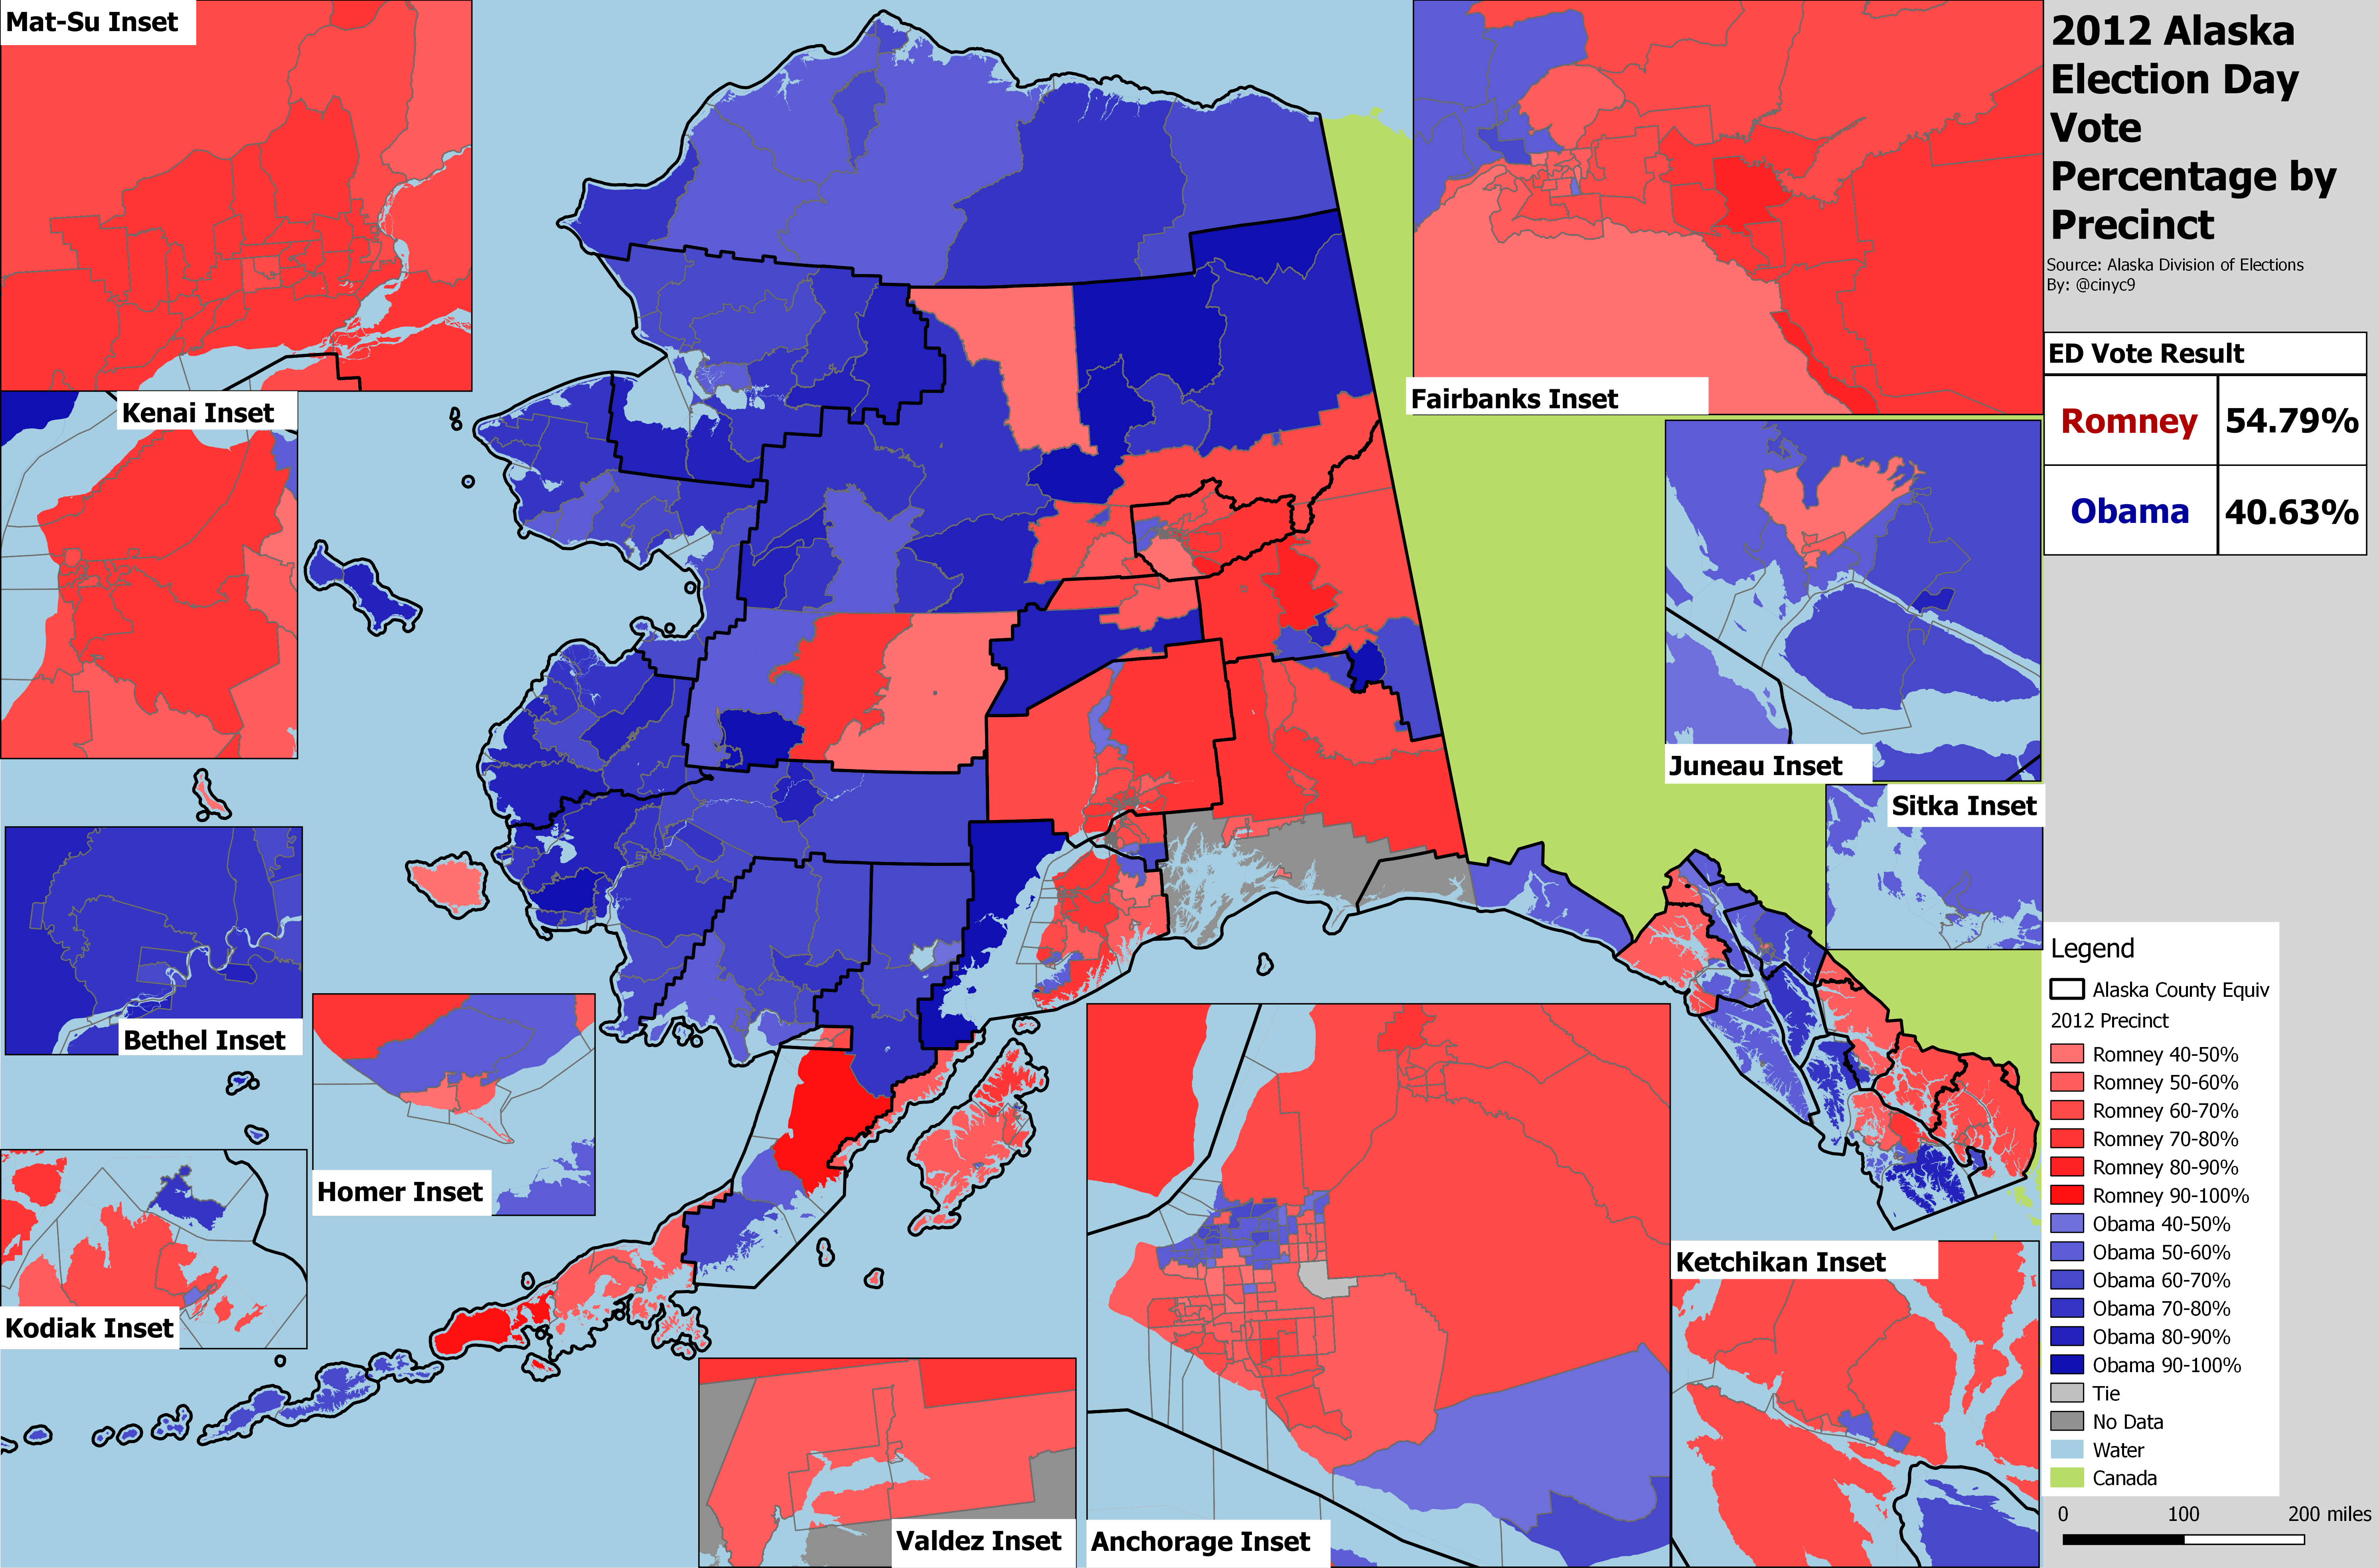
2012 - With No Alaskan on the Ticket, Republicans Fade a Little, but Romney Still Romps
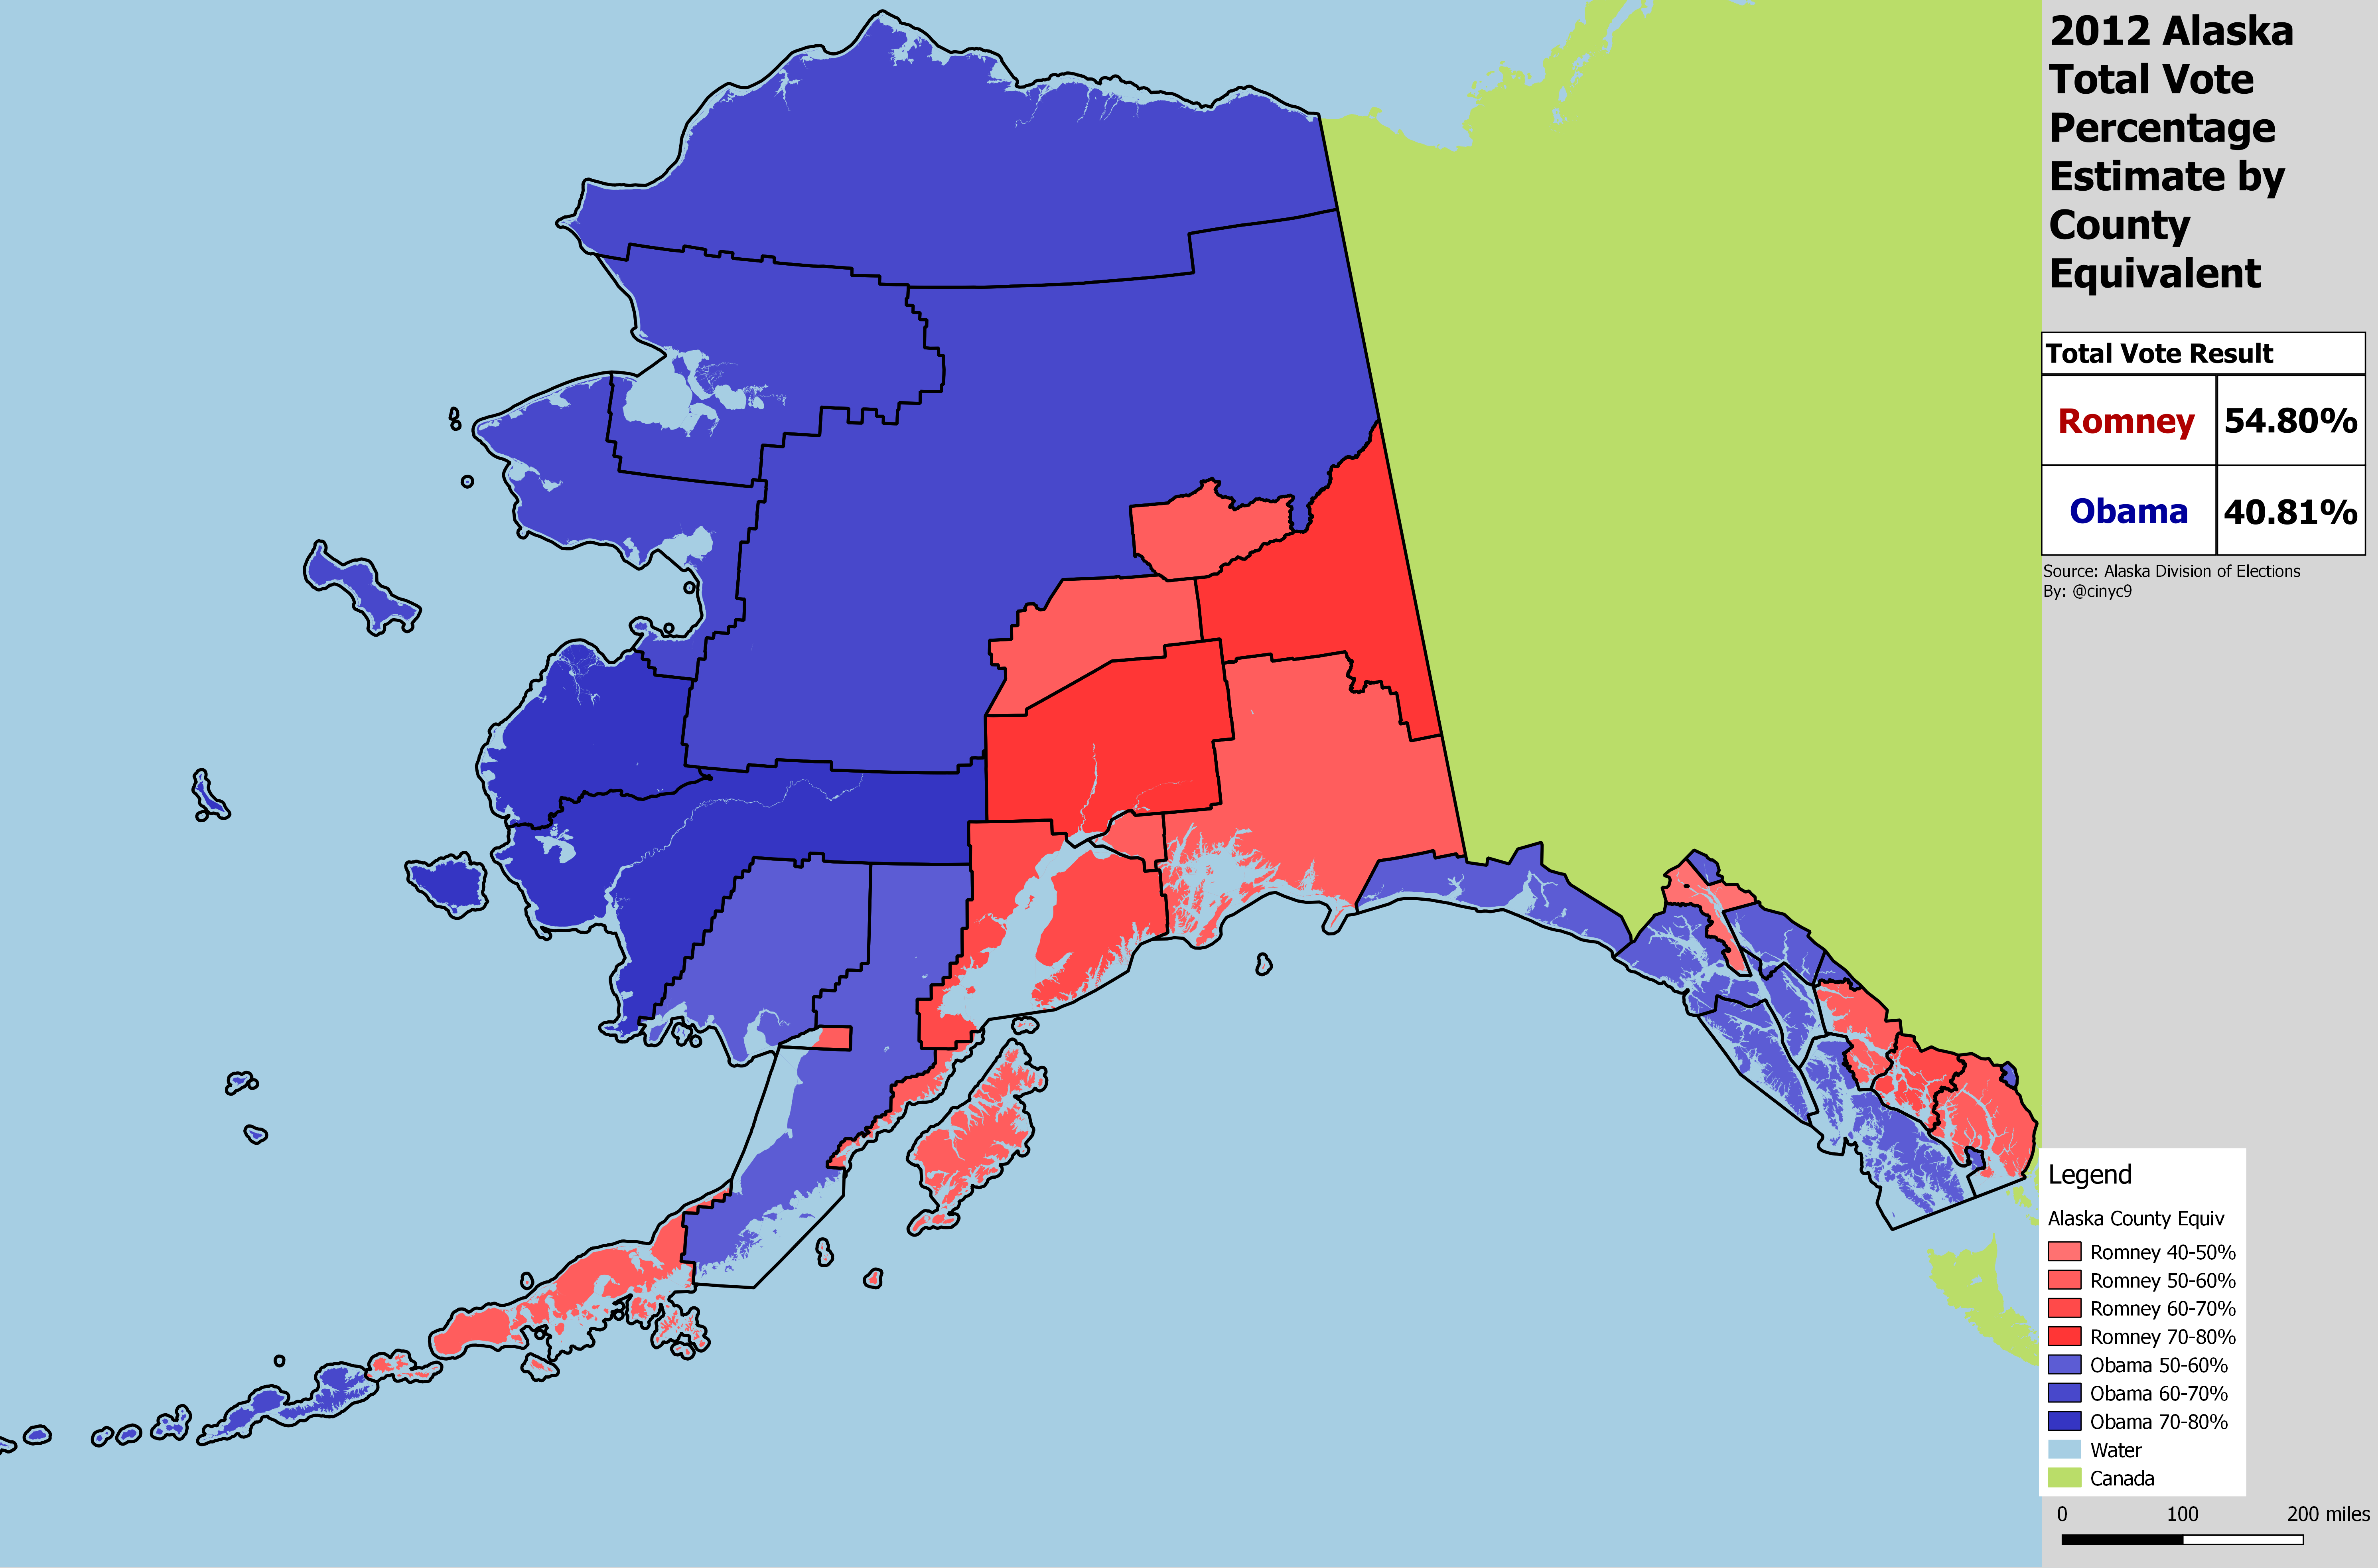
With no Alaskan on the ticket, Mitt Romney only won Alaska by 14 points in 2012. He badly lost most rural areas to incumbent Barack Obama. Libertarian Gary Johnson only received less than 3% of the vote and was largely a non-factor.
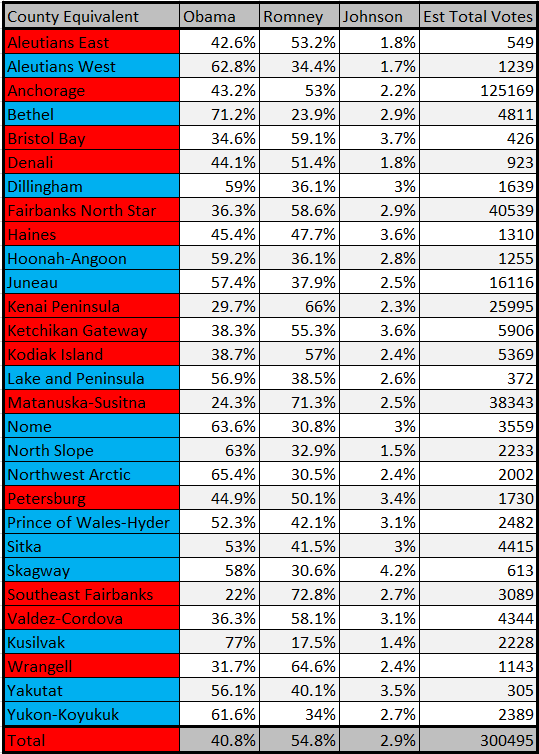
Like in 2008, Anchorage voted a little bit more Democratic than the rest of the state. Mat-Su further crept up on Fairbanks North Star, only casting about 2,000 fewer votes than what was then the second-largest borough.
The election day precinct vote map shows Obama winning almost all precincts in rural Alaska. The Anchorage D-R line crept even further to the south, and Obama won most Juneau precincts outside of the suburban Mendenhall Valley.
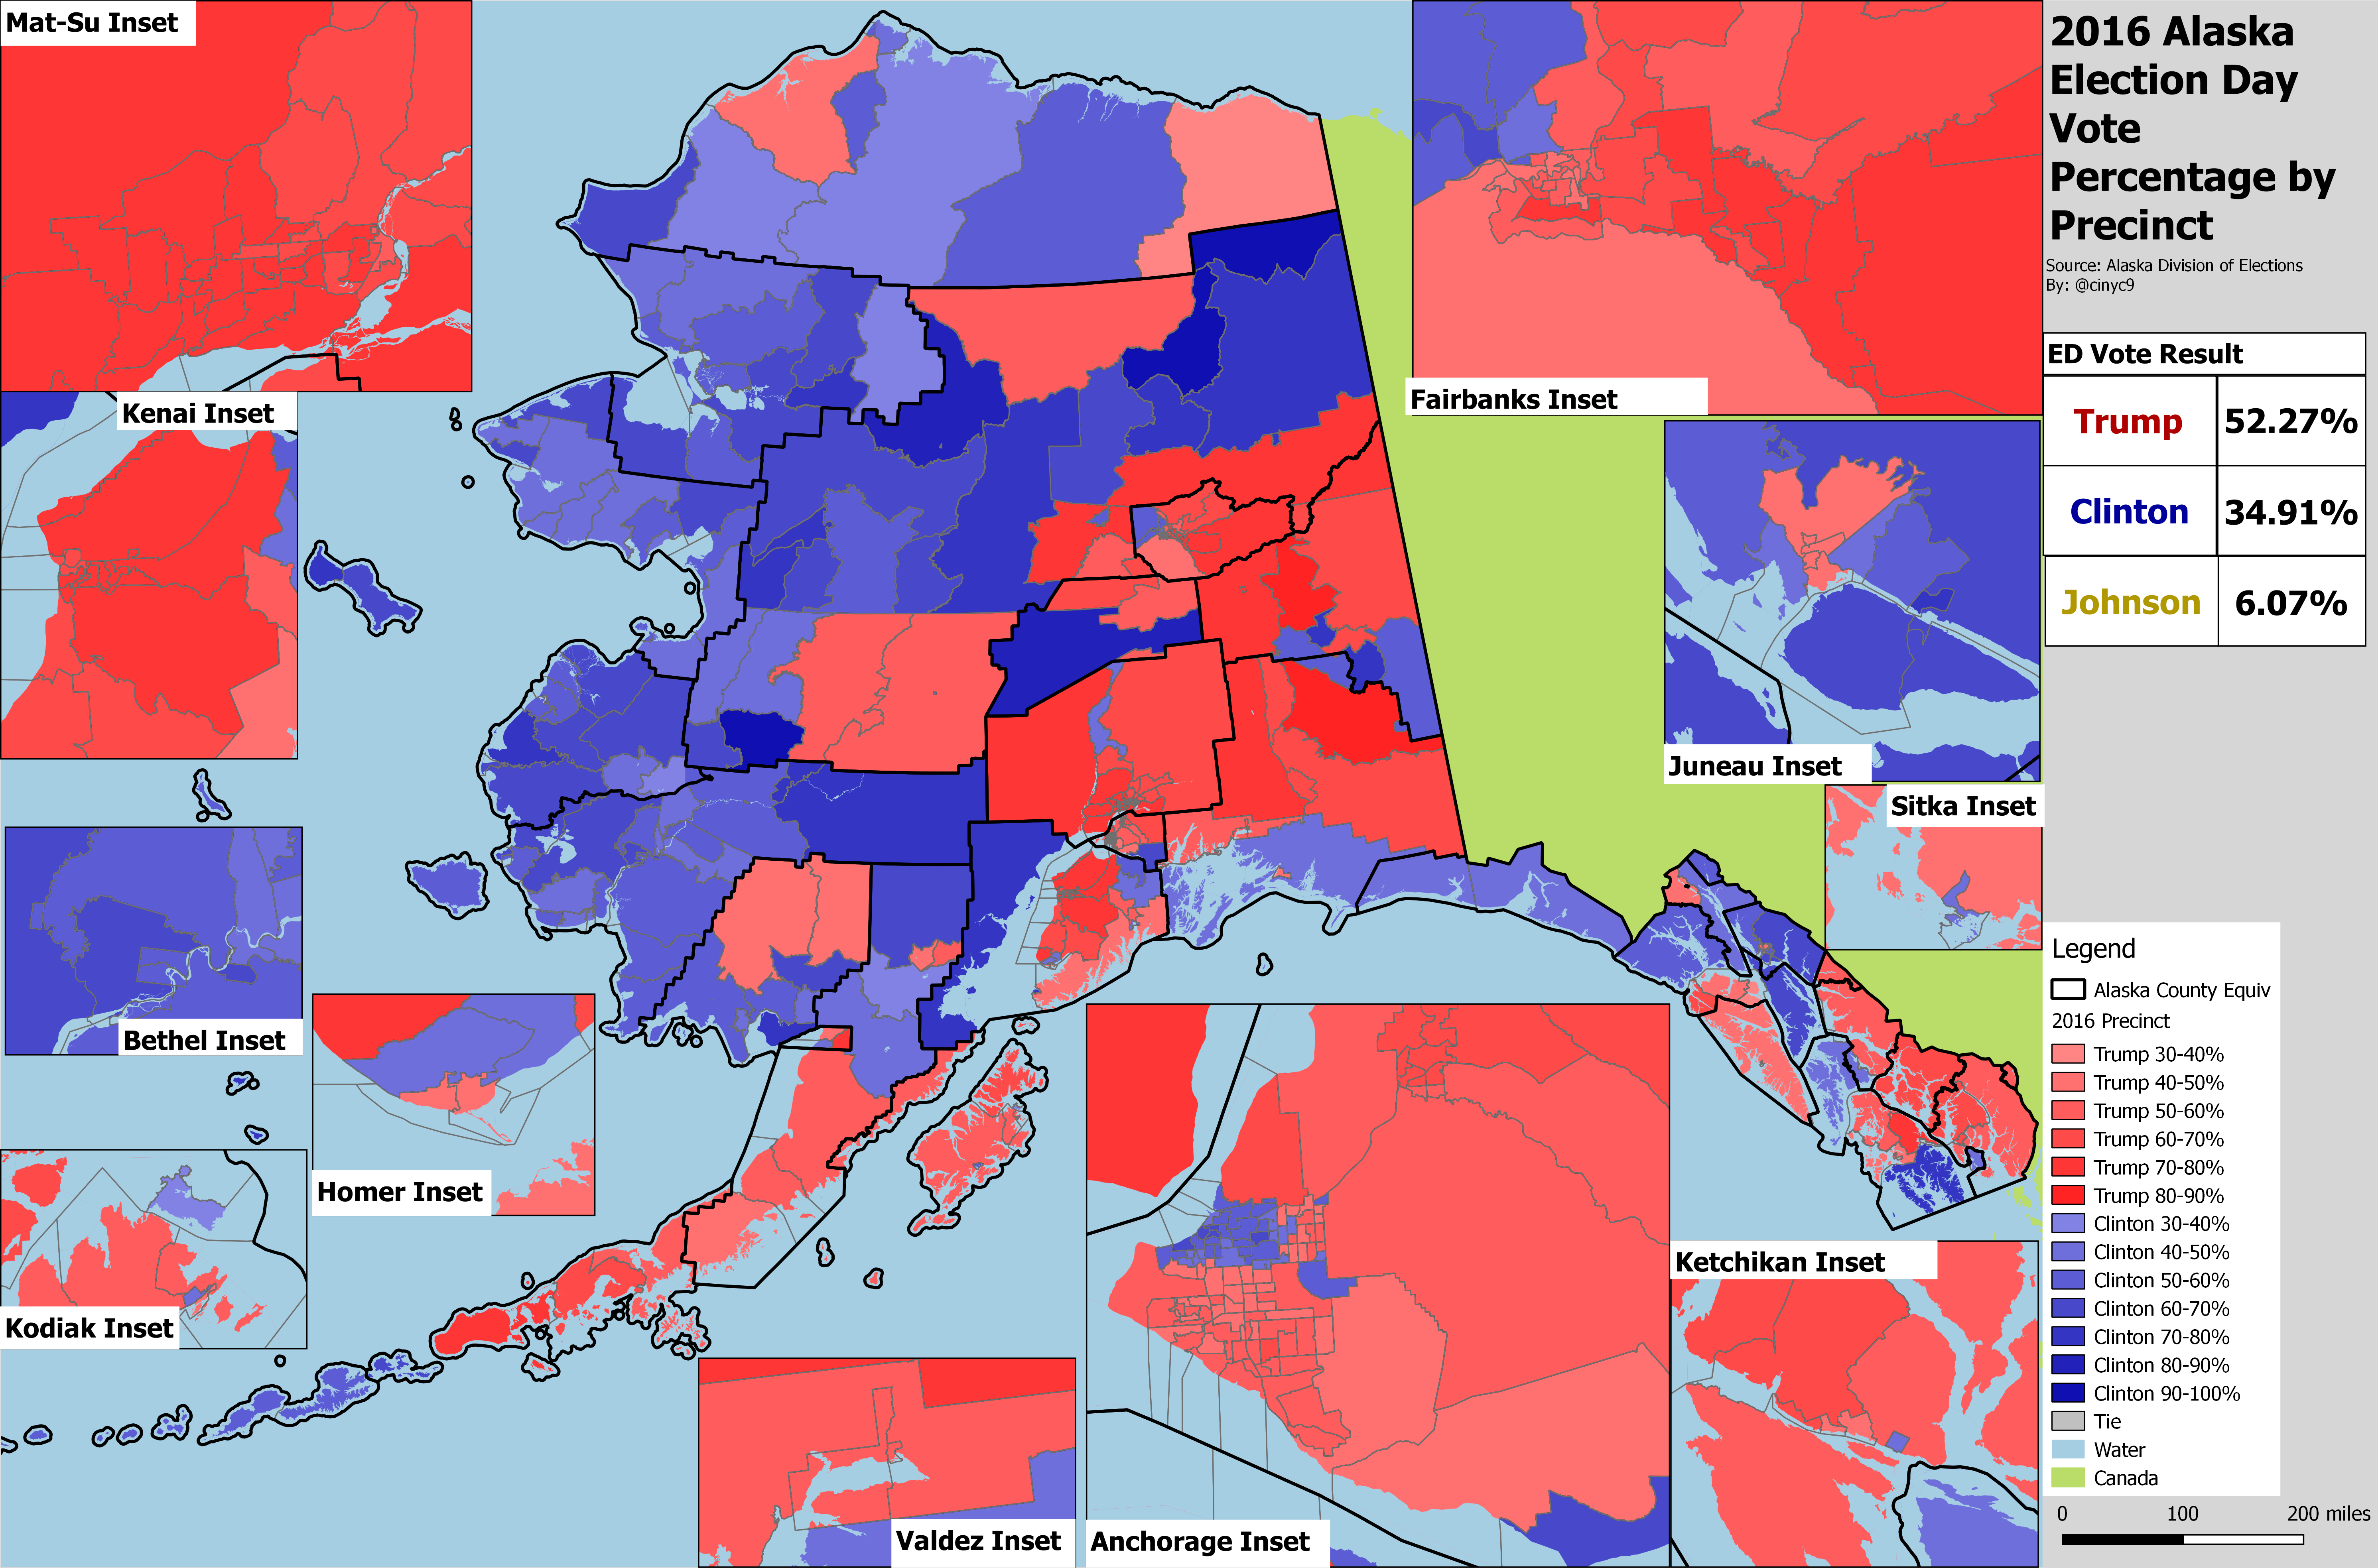
2016 - Alaska Aboard the Trump Train

Donald Trump won Alaska by 15 points in 2016. Both he and Hillary Clinton actually received a lower percentage of the vote than Romney and Obama in 2012. This was due to a better showing by third party candidates, including Gary Johnson, who doubled his percentage from 3% to 6% between cycles.
In general, the 2016 map looks a lot like the 2012 map. Anchorage crept even more toward the Democrats' column in 2016 relative to the rest of the state. Mat-Su, on the other hand, continued its staunch Republican support and now cast the second-most votes of any county equivalent, passing Fairbanks North Star.
The 2016 election day precinct vote map also looks a lot like the 2012 map with one big exception - the D-R line in Anchorage crept even further south, encompassing Midtown and neighboring precincts.
Conclusion
I'll conclude this with two charts. The first shows the historical R-D all-party margin from 1960-2016; the second shows the difference between that margin and the statewide average. Think of it as sort of a one-cycle state PVI for each jurisdiction:
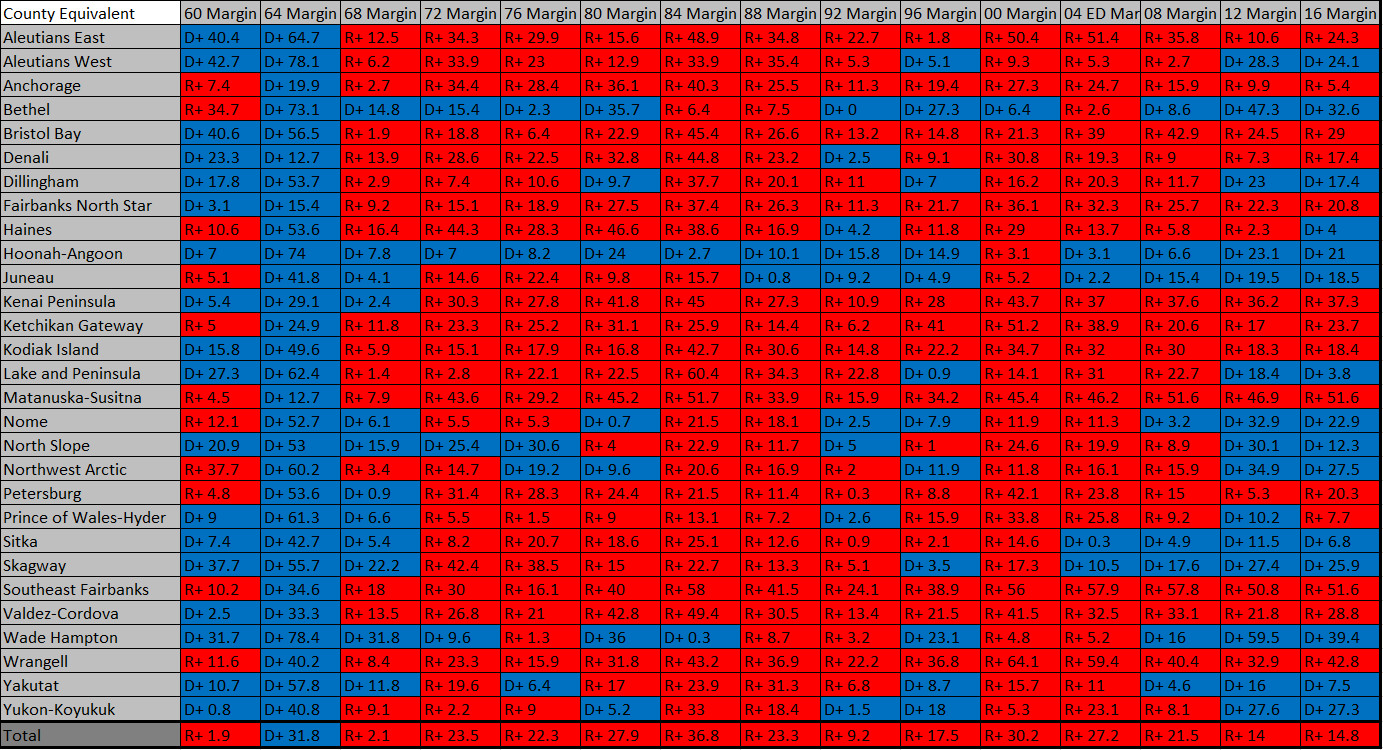
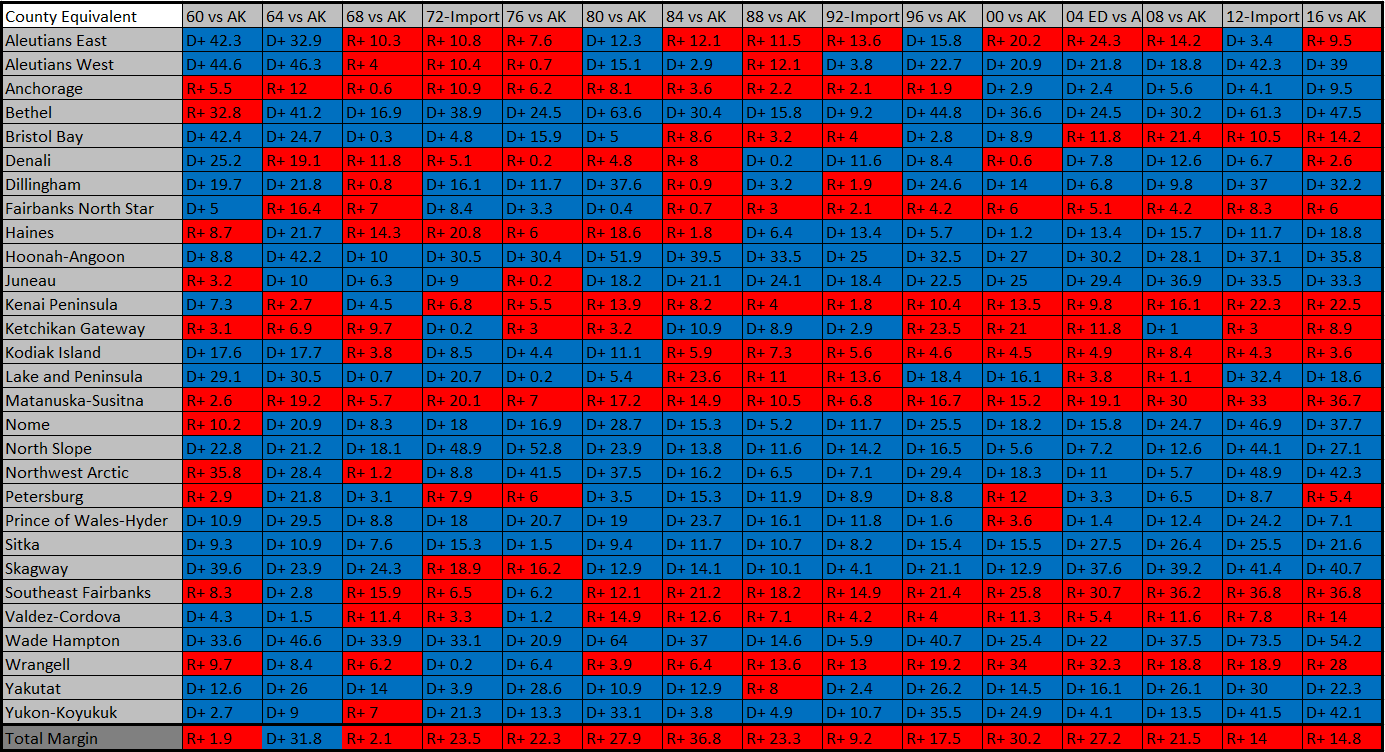
These charts show long-term trends outside of the South Central areas I generally focused on.
FYI - all of the Alaska spreadsheets I used to make these maps and charts are available here.